
A Toolkit for Schools to Inventory Data Assets and Inform Better Decisions - Organization
Improving Data Organization With a Data Inventory
While conducting an inventory, you may find that data are stored in many places across many departments. To address this, there are several strategies to improve data organization. A well-organized data inventory makes it easier to meet reporting requirements for federal and state mandates, which saves time and reduces stress during audits or accountability reviews; additionally, having a clear inventory reduces the risk of duplicated, conflicting, or incomplete data sources, ensuring more reliable reporting and analysis.
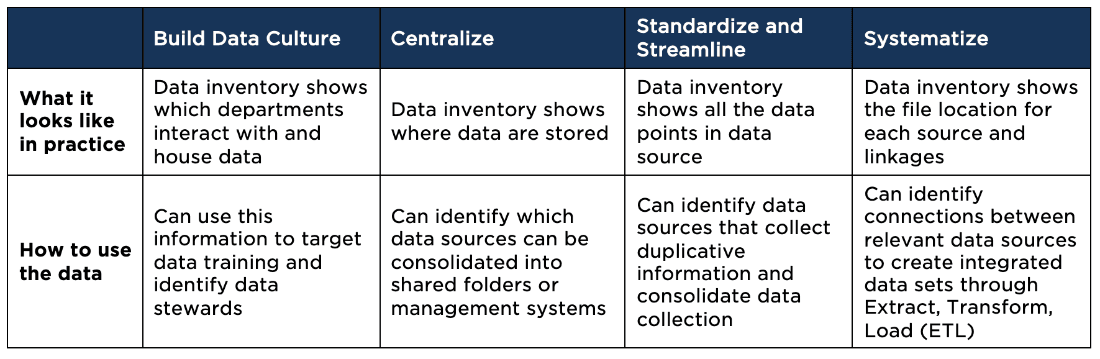
There are four strategies to improve data organization:
- Build data culture
- Centralize
- Streamline and standardize
- Systematize
The table below illustrates how to use the data inventory to help apply these data organization strategies.
Applying Data Organization Strategies With Data Inventory
Example data inventory
To follow the guidance below, you may find it helpful to download this sample data inventory.
Build a data culture
Developing a strong data culture begins with clear ownership and knowing who is using and accessing data. The inventory’s Access, Security, and Data Source columns identify which departments hold essential data, while the Purpose and Goal(s) columns reveal how those data align with strategic priorities.
Action steps
- Use: Review the Access and Security columns to identify departments with critical data.
- Action: Designate data stewards or champions to monitor Data Quality and ensure data remain accurate and updated.
- Use: Leverage the Access, Purpose, and Goal(s) columns to highlight why each data set matters.
- Action: Develop training programs on data management best practices tailored to your organization’s needs.
- Use: Refer to the Access and Security columns to define who can view or modify data.
- Action: Establish clear roles and permissions, ensuring that every team member understands their responsibilities.
Reflection: How can the detailed mapping of data sources, quality, and access guide your efforts to build a proactive data culture?
Centralize data
Centralizing data reduces fragmentation and improves accessibility. The Storage, Data Source, Data Points, and Access columns provide insight into where data are housed and who can retrieve these data, paving the way for consolidation across departments.
Action steps
- Use: Examine the Storage column to identify dispersed data repositories.
- Action: Consolidate these into a centralized data warehouse (e.g., Google BigQuery, Microsoft Azure, or Amazon Redshift) to streamline data management.
Shared folders/document management system:
- Use: Look at the Access and Storage columns to assess current file organization.
- Action: Implement shared folders or document management systems (such as SharePoint or Google Drive) with organized naming conventions and structured folders.
Reflection: What does your inventory reveal about your current data locations, and how can you consolidate these sources to improve efficiency and accessibility?
Standardize and streamline
Standardizing data entry and formatting minimizes errors and ensures consistency across an organization. The Data Points, Purpose, and Goal(s) columns are key to identifying inconsistencies and redundancies.
Action steps:
- Use: Refer to the Data Points and Purpose columns to assess current data entry practices.
- Action: Establish uniform standards (e.g., consistent date formats, terminology) to reduce errors.
- Use: Utilize the detailed definitions in the Data Points column.
- Action: Develop a comprehensive data dictionary that explains each variable and code.
- Use: Compare the Data Source and Data Points columns to spot redundancies.
- Action: Consolidate or phase out duplicative data collections to streamline your inventory.
Reflection: Which inconsistencies and duplications are evident in your inventory and how can standardizing your data entry practices improve overall data reliability?
Systematize processes
Systematizing processes ensures that data flow efficiently across systems, creating a unified and reliable source of truth. The Linkages column is essential for understanding how data from different sources connect and interact.
Action steps:
Extract, Transform, Load (ETL) tools:
- Use: Leverage the Linkages columns to see how various data sources relate.
- Action: Implement ETL tools such as Informatica, Talend, or Power BI to integrate data into a unified format.
Application Programming Interface (API) integration:
- Use: Review the Access and Storage columns to evaluate system compatibility.
- Action: Deploy APIs to synchronize data across platforms in real-time or through batch processing.
- Use: Examine the Data Quality, Security, and Linkages columns for insights into data consistency.
- Action: Adopt a Master Data Management (MDM) approach to ensure that core data (e.g., student, staff, and program information) remain consistent and updated across all systems.
Reflection: How can your inventory’s documentation of linkages and security measures drive the creation of integrated systems that deliver a single, reliable source of truth?
Example
A school district with multiple student databases might experience discrepancies in student enrollment figures when reporting to the state. By implementing a data inventory, the district can identify and consolidate different sources of student data, thereby eliminating duplicates and ensuring that reported enrollment numbers are consistent across all departments—thereby improving the reliability of their reports.