Healthy and Ready to Learn: National and State Data on 3-, 4-, and 5-Year-Olds
For the first time, national data can offer a holistic view of the developmental well-being of children ages 3 to 5. The Healthy and Ready to Learn (HRTL) measure, developed for use in the National Survey of Children’s Health (NSCH), captures young children’s development in five domains: early learning skills, social-emotional development, self-regulation skills, physical health, and motor skills. Together, these domains indicate whether young children are developmentally “on track” before entering kindergarten.
The HRTL data offer unprecedented insights into early childhood development, including state-level data on 3-, 4-, and 5-year-olds. The data suggest where—and in what domains—children are developmentally “on track” and where they need additional support. In addition, the data can be used to understand how family, community, and policy contexts influence developmental well-being.
The NSCH is a national annual survey completed by parents, the data from which provide state- and national-level insights into many aspects of children’s health and well-being. The final, validated version of the HRTL measure was first included in the 2022 NSCH. In the data dashboard and resources below, we present HRTL data for children ages 3, 4, and 5 from 2022–2024.
We updated this page on July 9, 2026 to add data for 4- and 5-year-olds and expand the data from two years (2023–2024) to three (2022–2024). Given that the dashboard focuses on single age groups, we now use three-year estimates to ensure more reliable state-level estimates and better facilitate comparisons between national and state data. We also added indicators to show which states differ from the national average. The two-year estimates for 3-year-olds that were previously published on this dashboard are available for download here.
HRTL Data Dashboard
This dashboard presents HRTL data from the NSCH showing the developmental well-being of 3-, 4-, and 5-year-olds in the United States. It shows the percentage of children who are developmentally “on track” in each domain and on an overall, summary measure of HRTL. Use the dashboard to explore by age, domain, and state.
Subscribe to the Healthy and Ready to Learn Newsletter
A Different Look at HRTL: The Number of Domains On Track and Needs Support
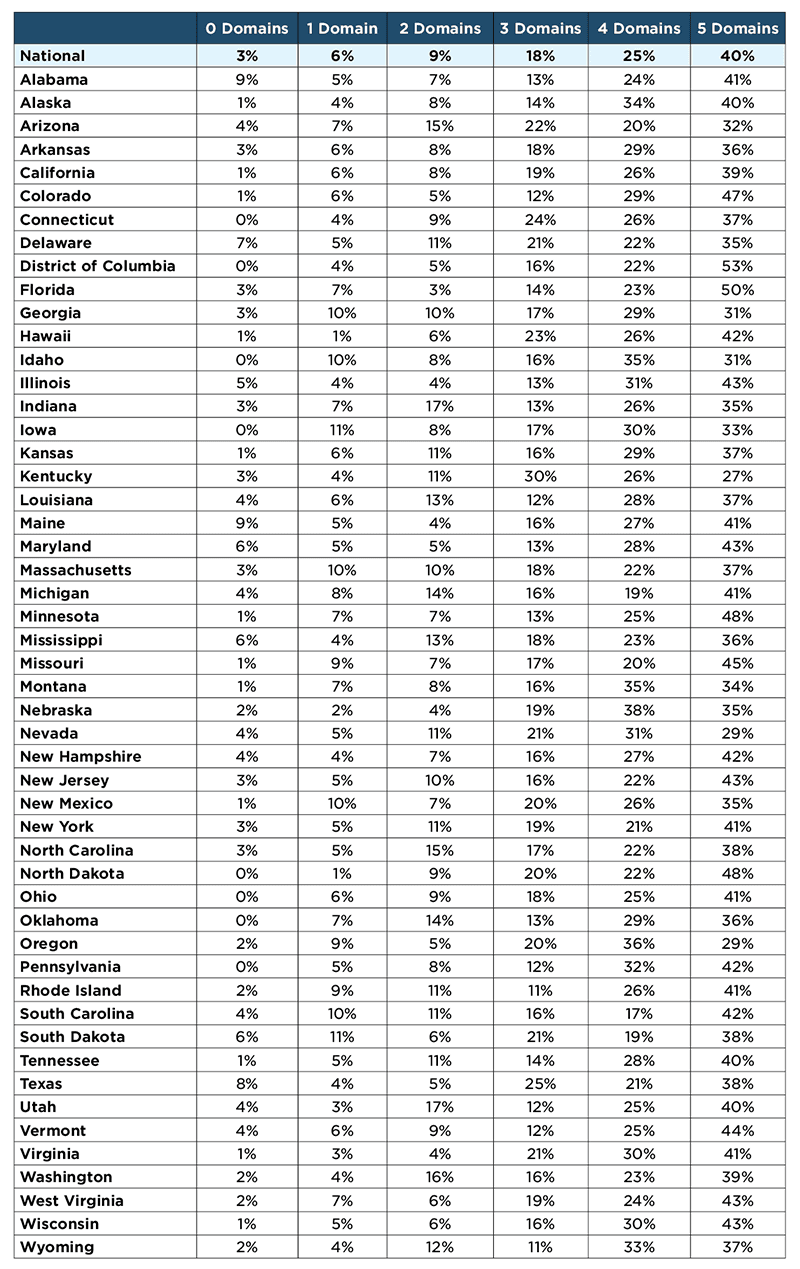
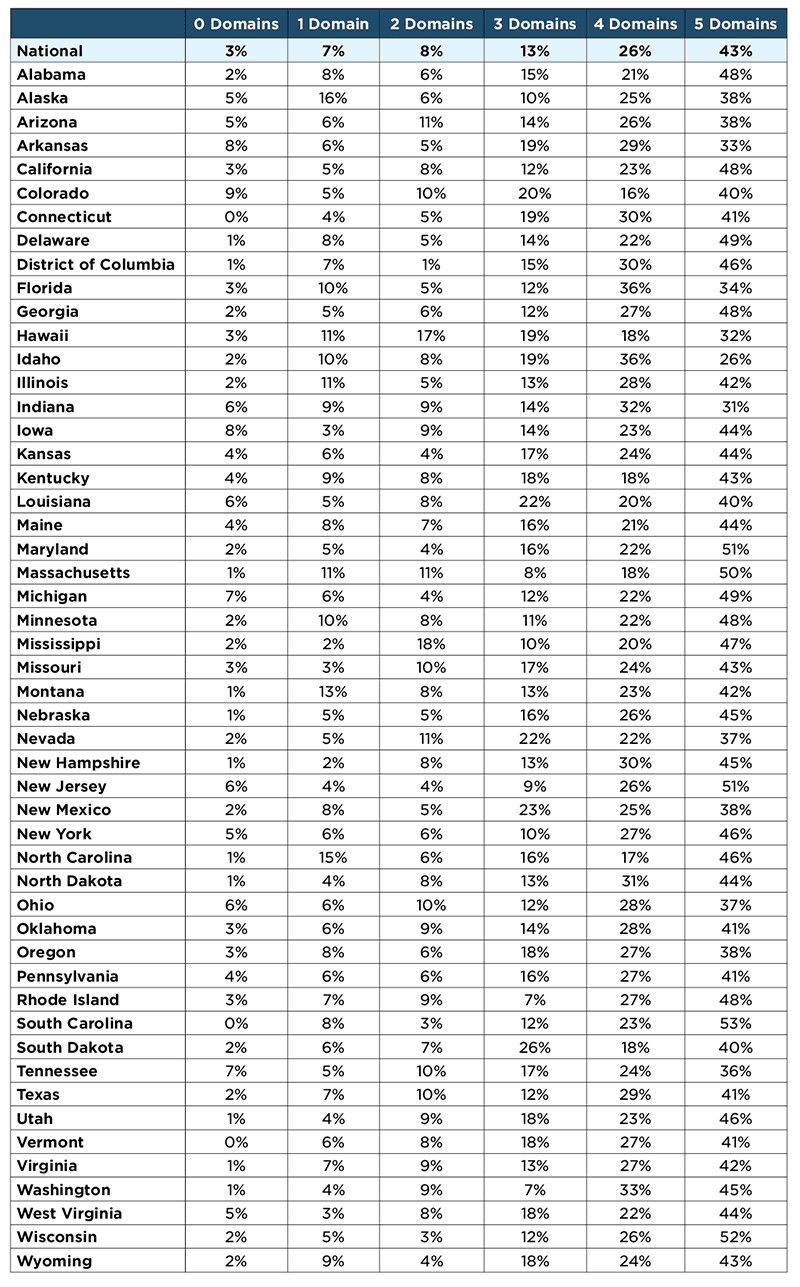
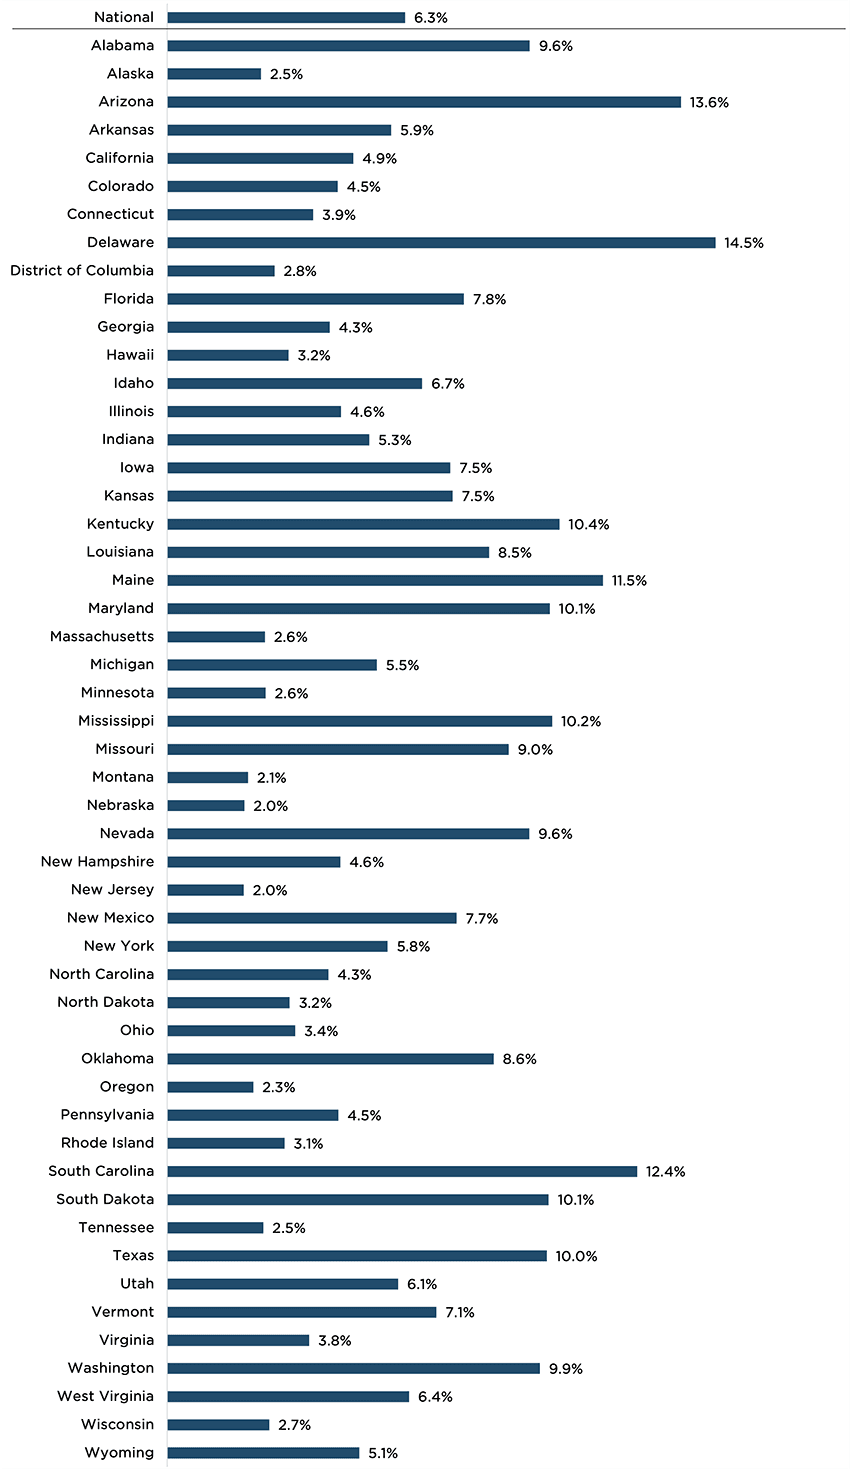
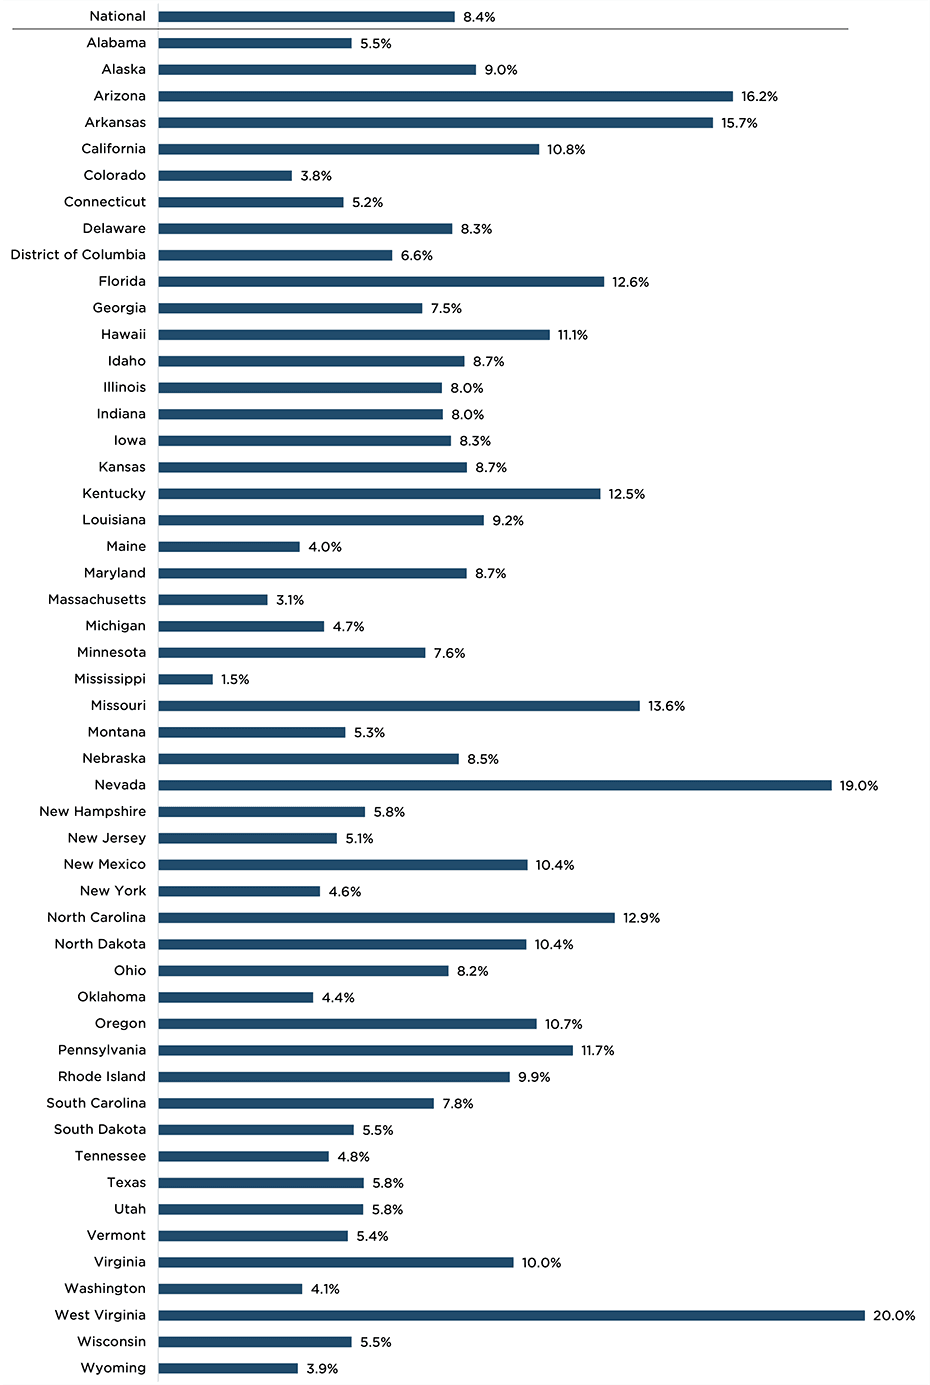
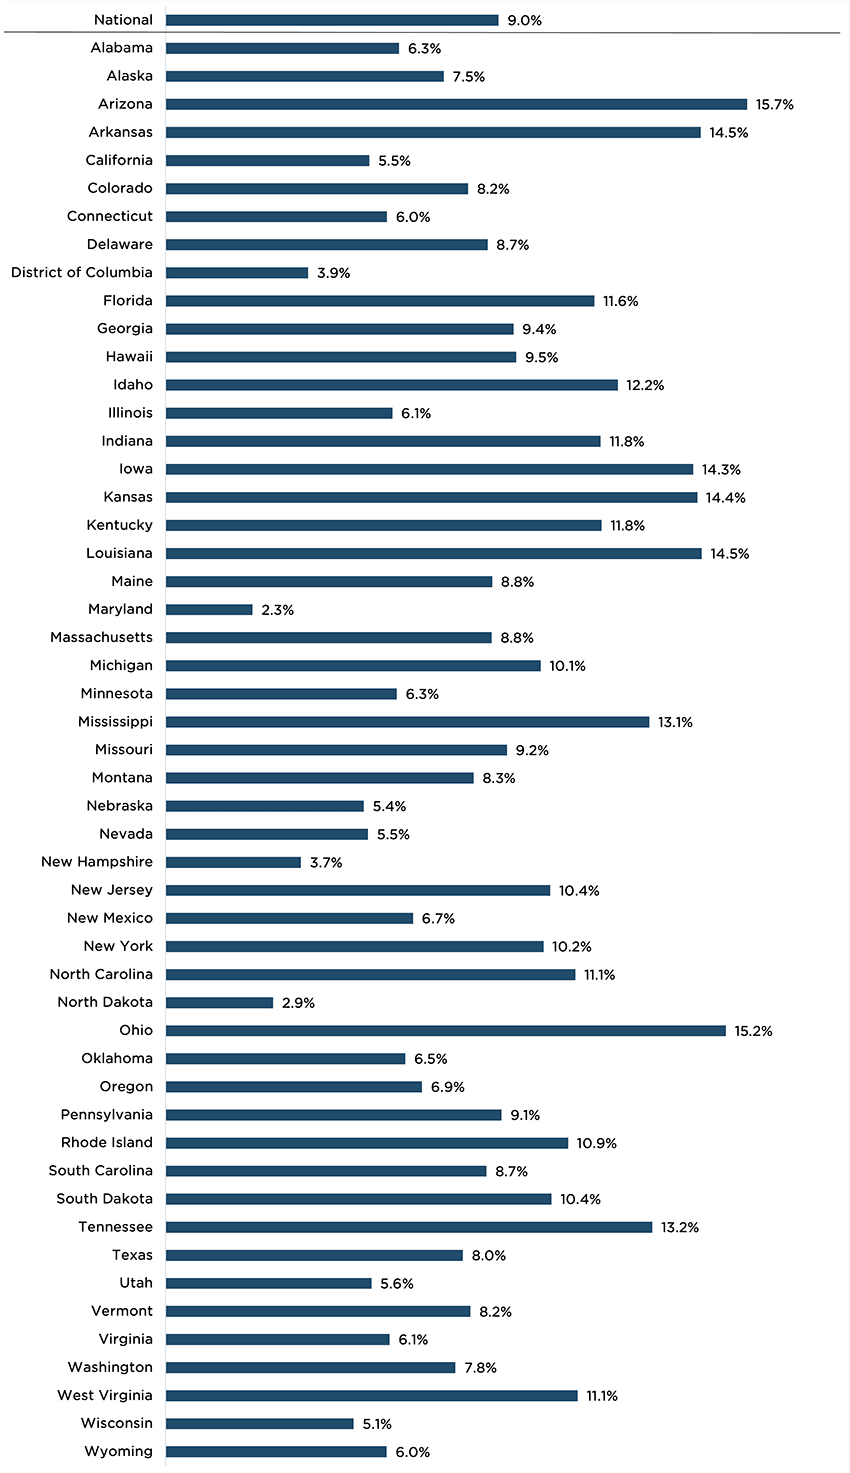
Another way to understand the national and state HRTL estimates is by examining the number of domains on which children score either “on track” or “needs support” (the lowest of the three scoring categories, with “emerging” as the middle category). While the percentage “on track” overall and by domain is one useful way of understanding children’s development at the national and state levels, it’s also possible to see the percentage of children who are “on track” in all domains or in none, along with the percentage who score “needs support” in two or more domains.
This also helps clarify how the overall HRTL measure is scored. To receive an overall “on track” score, a child must be “on track” in 4 or 5 domains, and have no domains for which they score “needs support.” The tables below present national and state data showing the percentage of children “on track” in 5, 4, 3, 2, 1, or 0 domains, as well as the percentage scoring “needs support” in 2 or more domains.
Number of Domains “On Track”
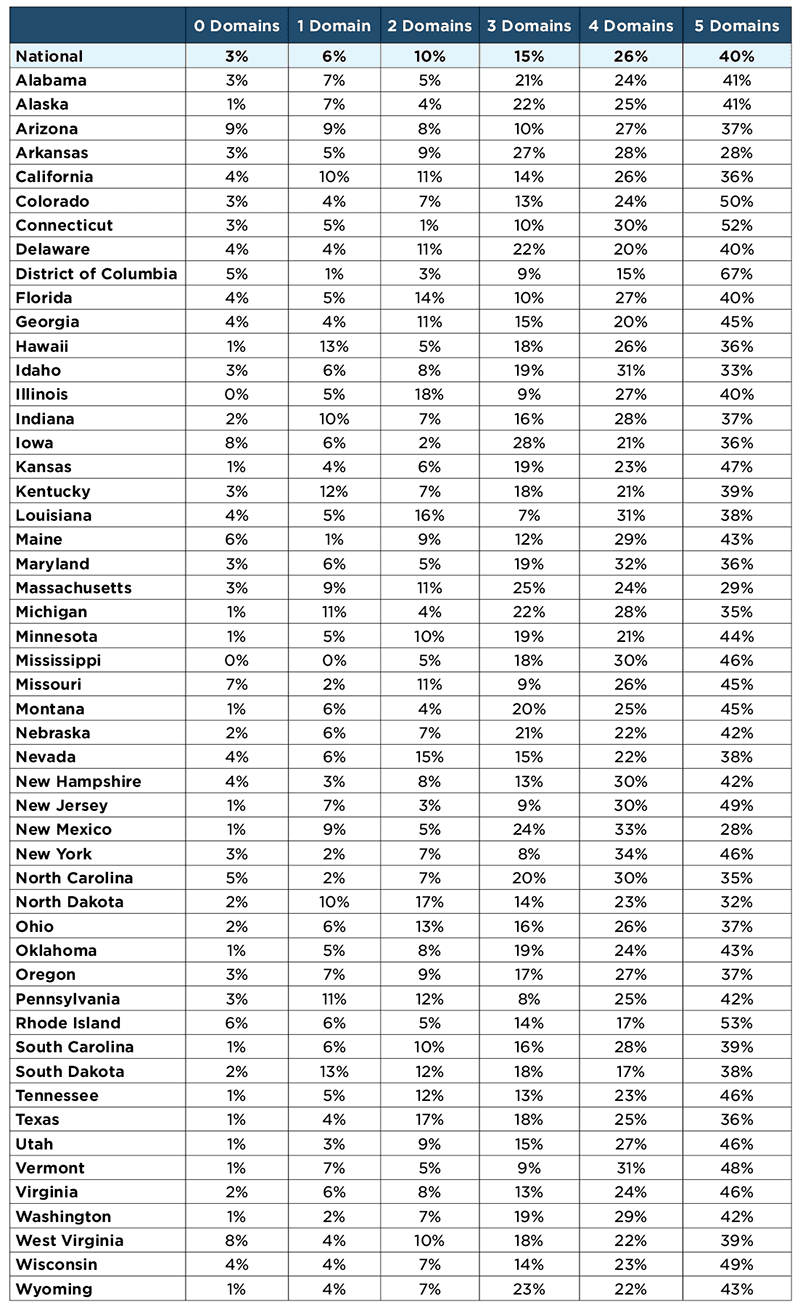
Number of Domains "Needs Support"
National Trends Over Time
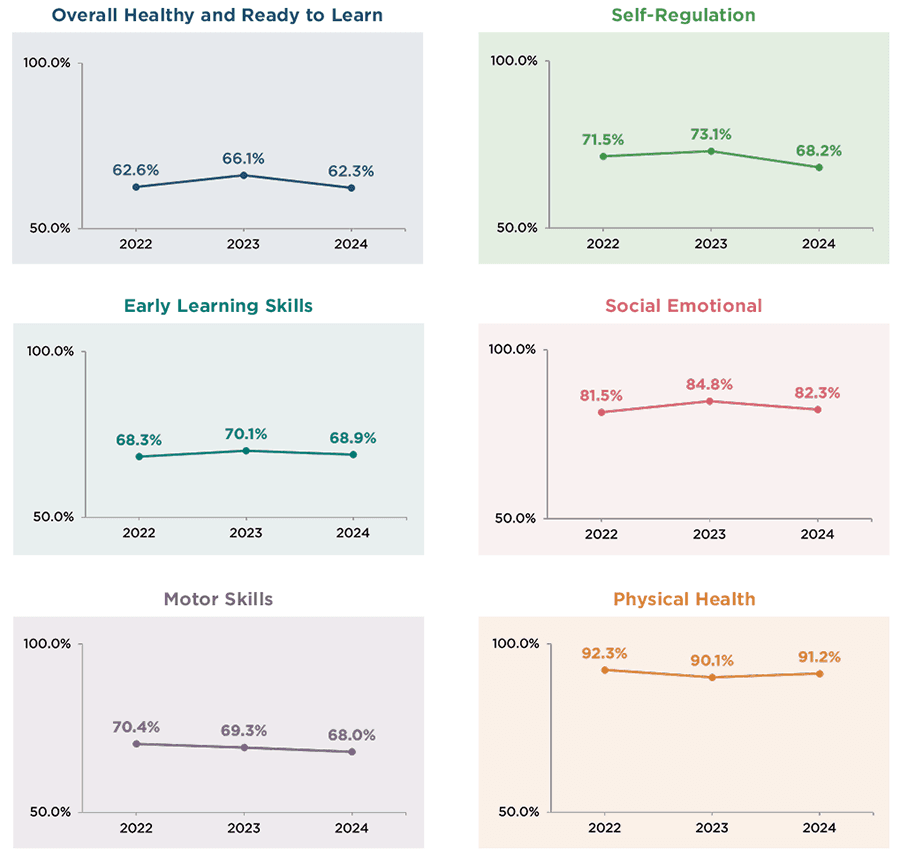
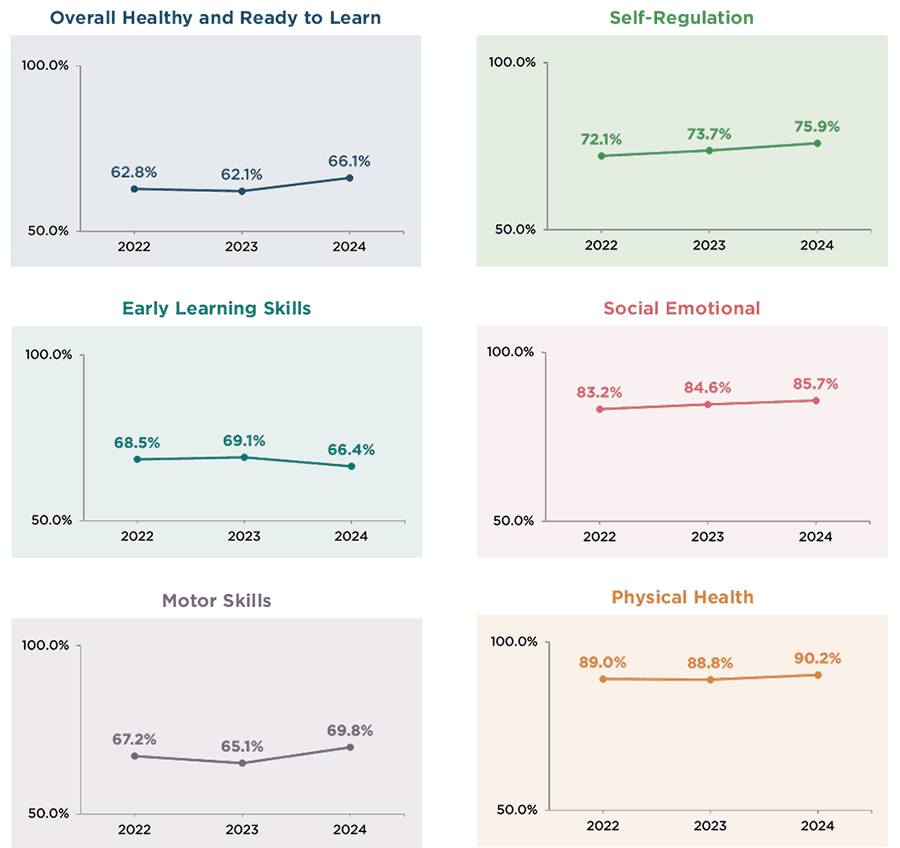
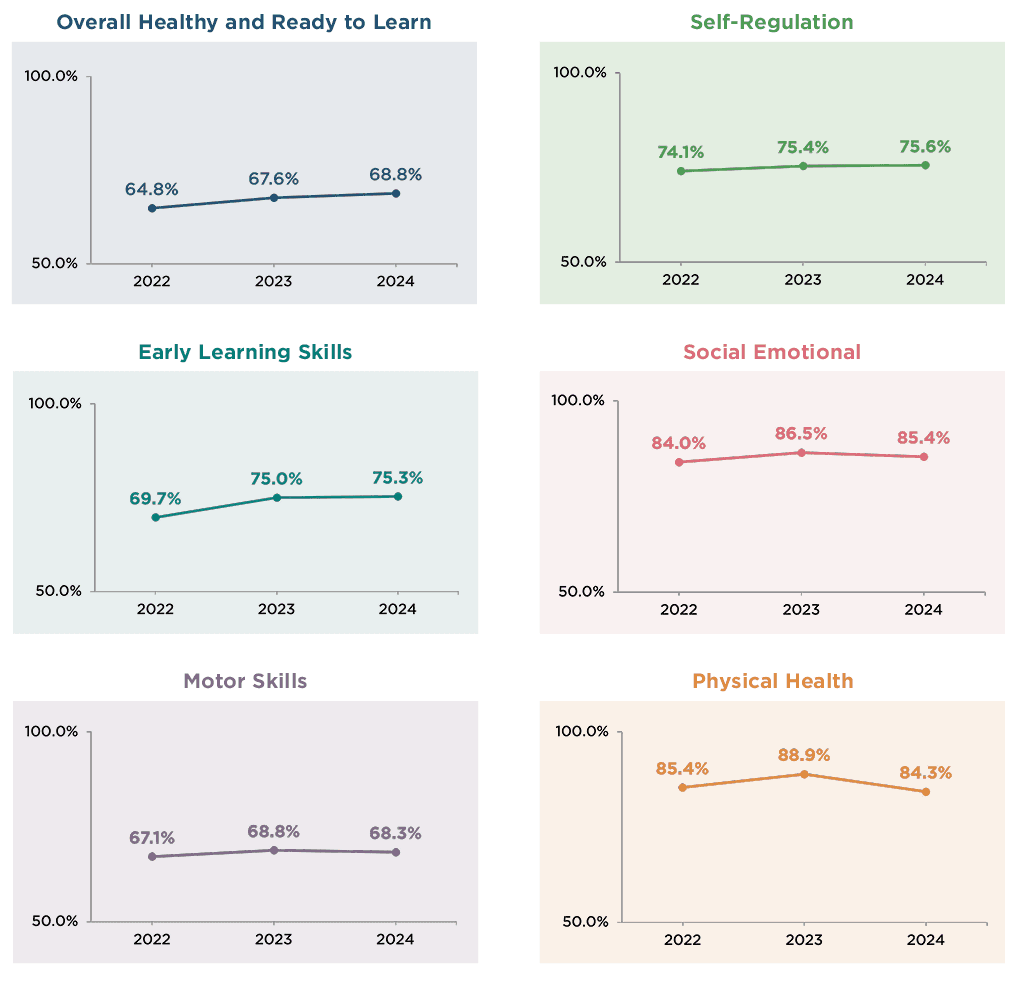
The NSCH is collected annually, so HRTL data are also available annually. These graphs show national data from 2022-2024, highlighting trends in the percentage “on track” on the overall summary measure and across the five domains for 3-, 4-, and 5-year-olds.
Data source descriptions and notes
The data displayed on this webpage are from the 2022, 2023, and 2024 National Survey of Children’s Health, which are nationally and state-representative surveys completed by U.S. parents of children from birth to age 18.
The 2022 sample includes 3,766 respondents representing 3,890,628 3-year-olds; 3,618 respondents representing 3,952,312 4-year-olds; and 3,737 respondents representing 3,918,254 5-year-olds.
The 2023 sample includes 4,005 respondents representing 3,783,493 3-year-olds; 3,979 respondents representing 3,904,451 4-year-olds; and 4,071 respondents representing 3,786,992 5-year-olds.
The 2024 sample includes 2,462 respondents representing a total of 3,773,897 3-year-olds; 2,489 respondents representing 3,828,309 4-year-olds; and 2,534 respondents representing 3,777,566 5-year-olds.
The combined 3-year sample includes 10,233 respondents representing 3,816,006 3-year-olds; 10,086 respondents representing 3,895,024 4-year-olds; and 10,342 respondents representing 3,827,604 5-year-olds.
The data displayed are weighted estimates with 95% confidence intervals. Statistical significance was determined using a two-sided, nested Z-test (p<0.05) and is influenced by the rate and precision of estimates—states that oversampled have a larger sample size and more precise estimates.
Child Trends’ work to analyze and share the latest HRTL data from the NSCH is supported by the Overdeck Family Foundation, Pritzker Children’s Initiative, and Valhalla Foundation. From 2016-2022, Child Trends partnered with the federal Human Resources and Services Administration’s Maternal and Child Health Bureau (HRSA MCHB) to develop, pilot, and refine the HRTL measure. Learn more about our work during the development and pilot phase here.