
Local and State Initiatives to Support Access to Infant/Toddler Child Care: A Case Study Approach - Research Approach & Methods
Research Approach
This study uses a mixed-methods case study design, combining policy document analysis, key informant interviews and focus groups with site leaders and implementation partners, surveys of parents and child care providers, and analysis of administrative data from child care subsidy, licensing, and quality rating systems across all three sites.
Methodology and Data
The following sections provide detailed descriptions of our study’s data collection and analysis methods. Each activity included data collection in each case study site, New Jersey, the city of Burlington Vermont, and the state of Vermont, unless otherwise specified. The following activities are described:
- Policy scan
- Qualitative data collection
- Administrative data analysis
- Quantitative data collection
The goal of the policy scan was to identify the policy features of each site’s initiative and related context and initiatives that shape the early childhood landscape in that site. The scan laid the groundwork for other data collection and analysis activities (e.g., surveys, focus groups, administrative data analysis, and interviews).
For each site, we reviewed relevant policy documents, such as legislation, annual reports, and publicly available documentation describing the details of each initiative. Site partners also helped identify relevant documents for review.
We drafted an initial policy scan framework in November 2024 and documented findings throughout 2025. The framework included information about the following topics, where available:
- Background information: program and policy origins, general descriptive information about the initiative and its components, and timeline.
- Structural characteristics: funding sources, funding amounts, and implementation partners.
- Implementation characteristics: eligibility criteria and related program requirements, priority populations, application and payment processes, communication strategies for providers and families, and number and amount of incentives available.
- Policy focus: the stated goals of the initiative.
- Impact: the number of individuals reached by the initiative.
- Challenges documented or changes implemented.
- Other related policies, programs, or events.
Site partners reviewed the policy scan findings to confirm their completeness and accuracy.
Qualitative data collection methods for the study included: (1) interviews with key stakeholders across all three sites; (2) focus groups with child care support specialists in New Jersey; and (3) focus groups with families in Burlington, Vermont. The purpose, recruitment methods, data collection and analysis approach for each of these activities are described in more detail below.
1) Stakeholder interviews across all three sites
Purpose
The goal of the stakeholder interviews was to build on the policy scan findings to better understand the origins of each policy, implementation successes and challenges, and recommendations for other state and local leaders interested in developing similar initiatives.
Recruitment
For all three sites, the study team used findings from our initial policy scan to identify a preliminary list of contacts to interview. Individuals were identified if they played an integral role in the initiative (e.g., design, implementation, leadership, advocacy, evaluation, or technical assistance). We shared this list of contacts with each of our site partners for input. Once the list was finalized, we reached out to these contacts via email and offered virtual 60-minute interviews to discuss the initiative.
Data Collection
We interviewed eighteen unique stakeholders: nine for New Jersey, four for Burlington, and six for Vermont.[1] Participants were informed of the study's purpose and provided verbal consent prior to each interview. Interviews were conducted virtually via Microsoft Teams with individuals or groups of up to three people if their roles closely overlapped. We also received written answers to our interview questions from one person in Burlington who was unable to attend live, bringing the total number of stakeholders who participated to nineteen. We conducted interviews on a rolling basis beginning in November 2025 until June 2026.
Together they brought a range of perspectives and roles in their initiatives, including:
- Oversight and implementation
- Design and development
- Evaluation and monitoring
- Outreach and communication
- Advocacy
To understand perspectives across multiple roles and collect comparable data for each site, we asked similar semi-structured discussion questions with each interviewee. Questions were designed to deepen our understanding of each initiative’s context and evolution and gathered information about the following topics:
- Stakeholders’ role in the initiative
- Context behind each initiative’s development, such as key actors (e.g., government champions, advocacy organizations), funding sources, and specific conditions the initiative aimed to address
- The initiative’s intended goals and target populations
- How the initiative was received by different groups (e.g., providers and educators, families)
- Implementation successes and challenges
- Insights on how the initiatives might continue to evolve
- Recommendations for other states or localities interested in implementing similar initiatives.
Data Analysis
Child Trends researchers transcribed the interviews using Microsoft Teams and reviewed the transcripts for accuracy. We then used the transcripts to fill in and complete our notes for each interview. We analyzed these notes and any written responses to the protocol questions using Dedoose, a qualitative data analysis software. We created an initial coding scheme based on our research questions, interview protocols, and emerging patterns and themes noted during data collection. The coding scheme was refined as new patterns and themes emerged during the coding process. All transcripts were coded by a research team member and reviewed by another team member to ensure accuracy.
2) Focus groups with New Jersey child care support specialists
Purpose
At the recommendation of New Jersey’s Division of Family Development (DFD), Child Trends engaged child care support specialists to better understand their experiences working with child care program directors, owners, and teachers who received Thriving by Three (TbT) grants. The goal was to understand how the TbT grants supported early childhood programs across New Jersey from the perspective of the individuals who work directly with providers. Specifically, we wanted to learn about which aspects of the grant were most effective, what successes or challenges they observed, and how support specialists supported providers.
Recruitment
We conducted virtual focus groups and interviews with four types of child care support specialists:
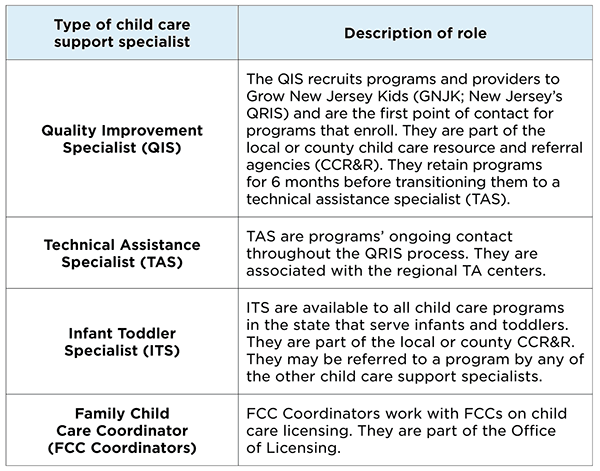
DFD invited all child care support specialists in New Jersey via email to complete an online form to indicate their role, interest, and availability for participating in a focus group. Child Trends also followed up with email reminders to support specialists who had not yet responded to the form.[2] Based on responses to the form, Child Trends researchers invited support specialists to participate in a 60-minute virtual focus group with others in similar roles. Participants who could not participate in a focus group due to scheduling conflicts were offered to participate in an individual interview, ranging from 30 minutes to one hour.
Data Collection
We spoke to a mix of child care support specialists from each role, including a total of 29 support specialists across seven focus groups and six individual interviews. Participants were informed of the study's purpose and provided verbal consent prior to each discussion. Focus groups and interviews were held in September and October 2025.
To understand perspectives across multiple support roles, we asked a set of similar semi-structured discussion questions with each of the support specialists who were involved in various aspects of the TbT initiative. We asked questions about the following topics to understand implementation processes, contextual challenges, and how the grants supported infant and toddler quality improvement:
- Effective grant components
- Strategies for program engagement
- Perceived impacts on practice and capacity
- Barriers programs encountered when expanding or improving infant/toddler services, enrolling in Grow NJ Kids, or meeting quality standards
- How challenges were addressed through coaching, technical assistance, and quality improvement navigation supports
- Examples of successes, positive outcomes, and growth observed among center-based and family child care programs
- Suggestions for strengthening future efforts modeled after TbT
Specialists did not always know which of the programs they worked with, if any, received TbT or facilities grants. Thus, it was not always clear which grant specialists were referring to (i.e., TbT, NJEDA Facilities grant, or another grant/incentive).
Data Analysis
Child Trends researchers transcribed the focus groups using Microsoft Teams and reviewed the transcripts for accuracy and removed any information that could identify the individual participants or their early learning programs. We then used the transcripts to fill in and complete our notes for each focus group. We analyzed these notes and any written responses to the protocol questions using Dedoose, a qualitative data analysis software. We created an initial coding scheme based on our research questions, focus group protocols, and emerging patterns and themes noted during data collection. The coding scheme was refined as new patterns and themes emerged during the coding process. All transcripts were coded by a research team member and reviewed by another team member to ensure accuracy.
3) Focus groups with Burlington, Vermont families
Purpose
In summer 2025, Child Trends administered a survey to families who received a subsidy through the Child Care Financial Assistance Program (CCFAP) from Vermont and/or a scholarship through the Early Learning Initiative (ELI) from the City of Burlington. We received a low response rate among those who received a First Steps scholarship (less than 10 responses), which may indicate barriers to survey participation among this population. Given the lower than anticipated response to the survey, we initiated a round of direct outreach to ELI families and encouraged them to participate in focus groups.
Recruitment
To reach families who had received a scholarship through ELI, Child Trends developed a Microsoft Form screener that asked respondents to express interest in participating in a focus group and preference for a virtual or in-person meeting. Respondents were also asked to identify their preferred dates and times to participate and their preferred contact method. ELI staff emailed the Microsoft Form link to all families who had received a First Steps scholarship and Child Trends followed up with interested respondents.
Data Collection
Six focus groups (four virtual and two in-person) were held with a total of eight families. Recruited participants were sent an electronic copy of the consent form and consent content was summarized at the start of each focus group. Verbal consent was obtained prior to recording and transcription began. Focus groups took place in January 2026 and each participant received a $50 gift card.
Focus group questions were designed to gain a better understanding of families' experiences applying for and receiving a scholarship, how the scholarship impacted them (e.g., ability to save more, better afford basic needs, or enter the workforce or school), and what it meant for them to no longer have a scholarship following the program's conclusion.
Because a small number of parents participated, the perspectives and experiences captured in the focus groups may not reflect the full range of experiences among families who received a First Steps scholarship.
Data Analysis
Child Trends researchers transcribed the focus groups using Microsoft Teams and reviewed the transcripts for accuracy and removed any information that could identify the individual participants or their early learning programs. We then used the transcripts to fill in and complete our notes for each focus group. We analyzed these notes and any written responses to the protocol questions using Dedoose, a qualitative data analysis software. We created an initial coding scheme based on our research questions, focus group protocols, and emerging patterns and themes noted during data collection. The coding scheme was refined as new patterns and themes emerged during the coding process. All transcripts were coded by a research team member and reviewed by another team member to ensure accuracy.
[1] One stakeholder discussed both Burlington’s Earling Learning Initiative and the statewide Act 76 initiative in Vermont.
[2] DFD provided Child Trends with a list of all child care support specialists across the state of New Jersey, including their contact information. Outreach was conducted to the following groups: 17 Quality Improvement Specialists, 77 Technical Assistance Specialists, 18 Infant Toddler Specialists, and 27 Family Child Care Coordinators.
Child Trends analyzed administrative data from each of the three case study sites: New Jersey, Burlington, and Vermont to understand access to infant and toddler care and participation in the programs for families and providers.
New Jersey’s Thriving by Three (TbT) Analysis
Child Trends partnered with DFD to examine the characteristics of programs participating in TBT. We drew on three data sources from 2023 to 2026: child care licensing data, TbT participation data, and child care subsidy data.
We first conducted descriptive analyses to examine the characteristics of programs participating in TbT. Program characteristics included program type, capacity (i.e., the number of children a program can serve), and geographic location. Statistical significance tests were used to identify program characteristics associated with TbT participation. We also examined factors associated with program closures, including TbT participation. Finally, we conducted a difference-in-differences (DiD) analysis to assess whether TbT participation was associated with an increased likelihood that programs began serving infants and toddlers. DiD compares changes in an outcome over time between a group affected by a program or policy and a comparison group that was not, which helps separate the program's association with the outcome from broader trends affecting all programs. To focus on programs that newly added infant and toddler care, we limited the TbT group to the 109 participating programs that were not serving infants and toddlers before enrolling. The comparison group included 5,680 programs that never participated in TbT.
Burlington’s First Steps Scholarship Program Analysis
Child Trends partnered with Burlington’s Community and Economic Development Office to examine the characteristics of families participating in the First Steps Scholarship Program (FSSP) between 2019 and 2025. During this period, 227 families applied to FSSP, and 185 enrolled. We defined families as enrolled if their status was listed as either "enrolled" or "supporting enrollment." Fifty-nine families were enrolled for more than one year. We conducted the analysis at the family level because some families had multiple children enrolled in FSSP. We examined household size, housing status (i.e., whether the family owned or rented their home), family income, language, household location, and reasons for needing child care. When a family's information changed over time, we used the most recent available record; if that record was missing, we used the most recent non-missing value from a prior year.
We also examined the characteristics of the 60 providers who completed the FSSP training between fall 2023 and spring 2025. Our descriptive analysis included providers' gender identity, race and ethnicity, language spoken, computer and internet access, and geographic location.
Vermont’s Child Care Subsidy Program Analysis
Child Trends partnered with Vermont’s Child Development Division (CDD) to explore the effects of policy changes on families with infants and toddlers participating in the state’s child care subsidy program. Specifically, we examined changes in (1) provider participation in the subsidy program, (2) family participation in the subsidy program, and (3) families’ child care cost burden, defined as the percentage of a family’s gross income that is spent on child care.
To examine provider participation in the subsidy program over time, we used data on registered child care providers from January 2020 to December 2025. We conducted interrupted time series analyses (ITSA), which examine both immediate and sustained changes to an outcome measure after an event, such as a policy change. We selected the second increase of reimbursement rates, July 2023, as the inflection point. Our models were segmented linear regressions that included three variables: overall time, whether each time point fell before or after July 2023, and time elapsed since July 2023. When autocorrelation was present, we corrected for it using generalized least squares. We applied the same ITSA approach, data source, time period (January 2020 to December 2025), and inflection point to analyze family participation in the subsidy program.
To analyze families' child care cost burden, we used CDD application and certificate (approved subsidy) data from July 2022 to May 2025. The analysis was limited to income-eligible families with infants and toddlers and excluded families receiving subsidies because of special needs, protective services, or participation in Reach Up (the state’s TANF program). We conducted descriptive analyses to examine changes in cost burden. We calculated cost burden for each family for each month they received subsidies and then averaged it at the family level. Finally, we disaggregated the sample by income level to examine whether cost burden differed across income groups. Three income groups were analyzed: families with incomes at or below 175 percent of the federal poverty level (FPL), 176 to 350 percent of the FPL, and above 350 percent of the FPL
Quantitative Data Collection
Quantitative data collection methods forthcoming.