




In the Adapted Measure of Math Engagement (AM-ME) project[1]—a three-year endeavor to enhance math learning environments and increase Black and Latino middle and high school students’ engagement in math—we partnered with five schools to investigate Black and Latino students’ experiences of math engagement and develop an evidence-based measure that administrators, researchers, and math teachers can use to assess that engagement. Ultimately, the project aims to create a set of survey questions that can be used across the country.
In this brief, we present a summary of the methods we used to validate the AM-ME and summarize the results of the scale development process. Scale validation is the process by which researchers test a set of questions to ensure that they accurately measure the underlying concept. The brief first describes the statistical methods used to evaluate the survey questions, then presents the final Adapted Measure of Math Engagement survey items. It concludes by presenting some statistics that are commonly used to show how well the proposed factor structure fits the data, and some tests that measure how well this scale works for different groups of students.
To validate the AM-ME, we began by administering a 70-item survey to 2,227 middle and high school students. To manage survey length and minimize respondent burden, we used a planned missingness design, distributing four blocks of items across six survey versions. Following best practices in scale validation, the collected data were then randomly divided into two halves for exploratory and confirmatory factor analysis.
An exploratory factor analysis (EFA) using maximum likelihood estimation on the first dataset identified an eight-factor structure, which was refined to 34 items after removing items with low factor loadings or cross-loadings. Operating under the hypothesis that these eight first-order factors represented a single, higher-order “math engagement” construct, we tested the model on the second dataset using confirmatory factor analysis (CFA) within a structural equation modeling framework, via R’s lavaan package. To appropriately model the ordinal Likert data and accommodate the planned missingness, we employed a robust weighted least squares estimator (WLSMV) alongside pairwise estimation, ultimately achieving acceptable model fit.
Finally, to ensure that the finalized scale functioned consistently and measured the same construct across student subgroups, we conducted measurement invariance testing. This involved evaluating a sequence of increasingly strict nested models: configural invariance to confirm the baseline structural pattern, metric invariance to test for equal factor loadings, and scalar invariance to test for equal item thresholds.
By demonstrating that model fit did not meaningfully deteriorate as these constraints were added, we provide strong evidence that the AM-ME scale works well for multiple groups of students. A full description of the methods can be found in our methods brief. Results for individual questions can be found in our infographic.
Results
The culmination of this three-year, mixed-methods participatory action research process is a 34-item, eight-factor scale measuring math engagement. The eight factors are defined as follows:
- Personalized Math Teaching refers to instructional practices that reflect students’ identities, backgrounds, and interests by connecting math content to their lives and experiences.
- Community Resources for Learning Math refers to support from adults outside of school that helps students learn math through resources, problem-solving help, and alternative strategies.
- Math Enthusiasm refers to students’ positive emotional and motivational attitude toward math, reflected in enjoyment of learning new skills, interest in challenging problems, and anticipation for math class.
- Math Identity refers to a student’s confidence in their mathematical abilities, shaped by their self-perception and the validation they receive from peers and teachers.
- Belonging in Math Class describes a student’s sense of safety, respect, and ability to be themselves in the math classroom, including their comfort in seeking help from peers.
- Math Usefulness captures a student’s recognition of math as a practical and valuable skill that is relevant to their daily life and future opportunities.
- Supportive Math Teaching refers to student-centered instructional practices that foster respect, fairness, and understanding by connecting content to students’ lives, offering learning choices, using diverse instructional methods, and responding to student needs.
- Math Learning Behaviors refer to students’ actions to build and apply mathematical understanding, including practicing new skills, using multiple strategies and tools, working independently, assisting peers, and explaining their thinking in different ways.
Each factor is evaluated using individual items, presented in the table below.
Table 1: Adapted Measure of Math Engagement Scale
.png&w=1920&q=75)
Note: Items are grouped by factor. Students responded on a Likert scale.
Validation
The scale was validated using exploratory and confirmatory factor analysis, as described in the Methods section above and in this methods brief. First, we identified an eight-factor model based on theory, exploratory factor analysis (EFA), a review of the literature, and the contributions of the AM-ME research group. This eight-factor model was then fit using confirmatory factor analysis on data not seen by the EFA, with missing values dropped pairwise, WLSMV as the estimator, and items treated as ordered. Both higher-order and non-higher-order models were considered. Table 2 presents the fit statistics for the confirmatory factor analysis.
Table 2: Confirmatory Factor Analysis Fit Statistics

Note. CFI = comparative fit index; TLI = Tucker–Lewis index; RMSEA = root mean square error of approximation; CI = confidence interval; SRMR = standardized root mean square residual
a Common guidelines based on Schreiber (2017).
These results suggest that the model fit is acceptable.
Measurement invariance
To ensure that the model worked equally well for all groups of students, we used formal test of measurement invariance to test how well the scale fit for Black and Hispanic students. We tested for configural, metric, and scalar invariance, defined as follows:
- Configural invariance: The factor structure is the same across groups.
- Metric invariance: Factor loadings are similar across groups.
- Scalar invariance: Item thresholds (means) are equivalent across groups.
Table 3 shows that models imposing configural, metric, and scalar invariance all retained acceptable fit, indicating that the AM-ME performs equally well across groups of students. The statistics presented below are for the full sample due to the need to use all observations to have adequate data size.
Table 3: Measurement Invariance Model Fit Statistics
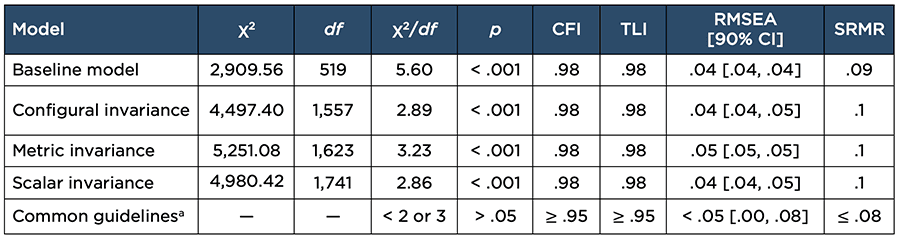
Note. CFI = comparative fit index; TLI = Tucker–Lewis index; RMSEA = root mean square error of approximation; CI = confidence interval; SRMR = standardized root mean square residual
a Common guidelines based on Schreiber (2017).
[1] The AM-ME project is a partnership between Child Trends, Search Institute, McREL International, and Bloomington Public Schools.
Suggested citation: Kelley, C., Holquist, S., Crowder, M., Hsieh, D., Scott, A., Yu, M., & the Adapted Measures of Math Engagement Research Group. Scale development results from the Adapted Measure of Math Engagement (AM-ME). Child Trends. DOI: 10.56417/8905x5141n
This project is funded by the National Science Foundation, grant #2200437, and by Overdeck Family Foundation. Any opinions, findings, and conclusions or recommendations expressed in these materials are those of the author(s) and do not necessarily reflect the views of the funders.