


Families’ social, demographic, and economic circumstances can have direct and indirect effects on children’s development. Structural inequities in access to resources such as education, income, or food can promote disparities in children’s health and school readiness.[1],[2] Similarly, children can face more or fewer barriers in their development depending on their race and/or ethnicity. The question addressed in this brief is whether children ages 3 to 5 from families of different backgrounds differ with respect to their health and readiness to learn. The analyses presented in this brief examine the associations between various social, demographic, and economic factors and the extent to which a child is reported to be healthy and ready to learn, using data from the 2017 and 2018 waves of the Health Resources and Services Administration Child Health Bureau's (HRSA MCHB) National Survey of Children’s Health (NSCH) for children ages 3 to 5. Data are nationally representative of children in this age range.
Key findings
Several key factors are consistently related to how healthy and ready to learn a preschool child is found to be.
- Access to economic resources. Preschool children whose families report experiencing food insecurity are less likely to be described by their parents as healthy and ready to learn, compared with their peers whose families are food secure. Similarly, family income shows a strong relationship with preschool children’s health and readiness to learn. These associations remain statistically significant when we account for (that is, statistically control for) other socio-demographic factors. Statistical significance is addressed further in the discussions section of this brief.
- Parents’ characteristics. Parents who report higher educational attainment are considerably more likely to describe their children as healthy and ready to learn. Similarly, married parents are more likely to report that their preschool children are healthy and ready to learn. However, these differences are not statistically significant when analyses control for other socio-demographic factors.
- Language spoken at home. Preschool children from homes where English is the primary language are more likely to be reported to be healthy and ready to learn than those from homes with a primary language other than English, but this difference is no longer statistically significant when we control for other socio-demographic factors.
- Race, ethnicity, and gender. White preschool children are more likely to be reported by parents to be healthy and ready to learn, compared to Black and Hispanic preschool children. However, when analyses are controlled for other socio-demographic factors, these differences are no longer statistically significant. Preschool girls are more likely to be healthy and ready to learn than preschool boys, even when controlling for other socio-demographic
About the survey and measure
Parents or caregivers who participated in the Health Resources and Services Administration’s (HRSA) National Survey of Children’s Health (NSCH) reported on a set of items about their child’s development. From these responses, measures of each child’s health and readiness to learn were developed for four domains: self-regulation, health, early learning, and social emotional competencies. Specifically, with respect to their development, HRSA’s Maternal and Child Health Bureau (HRSA MCHB), with Child Trends, identified children as “On Track,” “Emerging,” or “Needs Support” in each of the four domains. In addition, an overall summary National Outcome Measure of Healthy and Ready to Learn (HRTL) was defined according to whether children were healthy and ready to learn in all four domains, in three domains, in two domains, or in zero or one domain. This brief uses the metric of On Track in all four domains as representative of being “Healthy and Ready to Learn.”
Analyses assess a range of characteristics related to being On Track in all four domains of the HRTL measure.* These social and economic conditions are described by parents in the NSCH and include family income, food security, parents’ education, family structure, household primary language, access to health insurance, children’s race, children’s gender, and children’s age. Associations or differences described in this brief reflect statistically significant differences as indicated by a p-value < .05. Furthermore, we used multivariate analyses to repeat the main analyses controlling for social and economic factors, including child race, sex, parental education, family structure, and family income. The findings from the multivariate analyses help to distinguish the association of each characteristic with an HRTL score from other known influences on child development. We present the findings from multivariate analyses in the text; please contact the authors for detailed tables of findings.
Further details on the HRTL measure can be found in Appendix A. Details on each socio-demographic measure, including the wording of items and response options, are available in Appendix B. Findings for each of the measure’s four domains are presented in Appendix C. Two related briefs provide additional analyses drawn from HRTL data: One brief examines the association between children’s score on the HRTL measure and their family and neighborhood characteristics, and the other explores the association between the HRTL measure and child characteristics. **
* Details on each covariate including item wording and response options are available in Appendix B.
** These family and neighborhood characteristics include family strengths, family routines, parent physical and mental/emotional health, parenting difficulties, the parent’s emotional support for parenting, neighborhood amenities and challenges, and neighborhood supports for childrearing. The child experiences include frequency of book reading, amount of screen time and sleep, presence of a special health care need, access to family-centered care in a medical home, and exposure to adverse childhood experiences.
The Healthy and Ready to Learn National Outcome Measure
The pilot Healthy and Ready to Learn Title V Maternal and Child Health Services Block Grant National Outcome Measure (NOM) was developed by the Health Resources and Services Administration’s Maternal and Child Health Bureau (HRSA MCHB), in collaboration with Child Trends. The measure uses data from the National Survey of Children’s Health (NSCH), a nationally representative, annual household survey funded and directed by HRSA MCHB, and designed to be completed by parents of children ages 0 to 17; Healthy and Ready to Learn questions are specific to children ages 3 to 5. It is a whole-child assessment that covers four domains of development: early learning skills, social-emotional development, self-regulation skills, and physical health and motor development. For more information on the development of the measure, please visit the HRTL description and FAQ page and Appendix A.
Findings
Children in higher-income families are substantially more likely than children in lower-income families to be healthy and ready to learn, even when controlling for other socio-demographic characteristics.
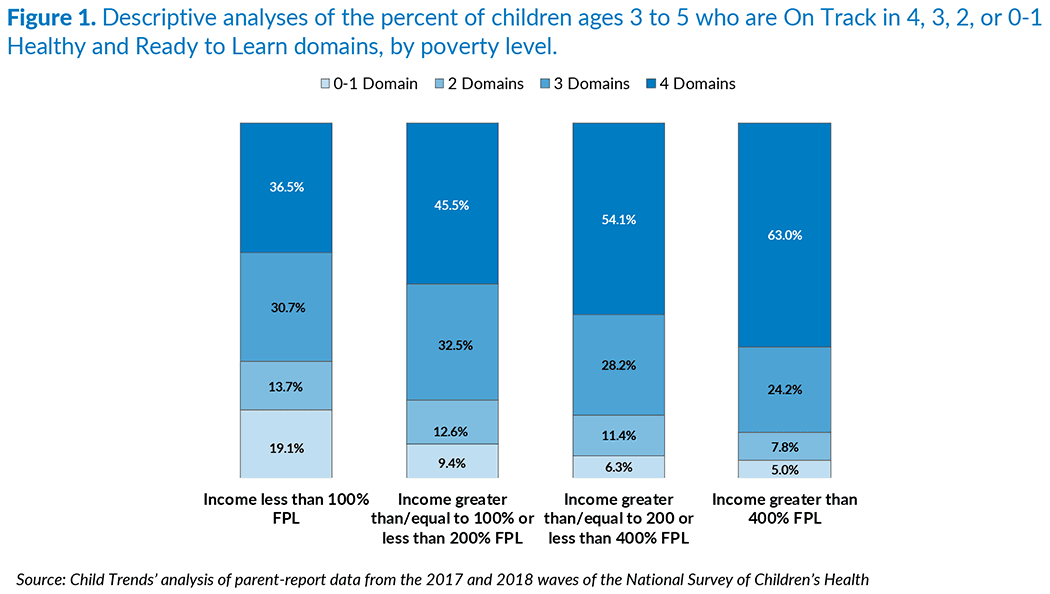
Lack of adequate family economic resources can compromise children’s ability to grow and achieve success in adulthood. Lack of resources can undermine parents’ ability to procure the goods and services that enhance children’s development. Access to economic resources can also affect families through children’s exposure to environmental stressors that may harm their development, such as crime or lack of neighborhood amenities.[3] Families with more economic resources are also more likely to have stable family environments promoting healthy development for children.[4] In the NSCH, the family poverty ratio is calculated as the ratio of total family income to the family poverty threshold. The family poverty threshold is derived from the Census Bureau’s poverty thresholds. Thresholds vary by family size and the number of related children under 18 years old. Using these thresholds, we created four groups: less than 100 percent of the federal poverty level, from 100 to 199 percent of the federal poverty level, from 200 to 399 percent of the federal poverty level, and 400 percent or more of the federal poverty level.
As Figure 1 shows, children in families with the highest income-to-poverty level ratios are more likely than children in families with lower ratios to be On Track in all four domains. The differences can be substantial; for example, whereas 63 percent of preschool children in families with incomes greater than 400 percent of the federal poverty level are On Track in all four domains, just 37 percent of preschool children in families with income below the poverty line are On Track in all four domains. One in five children living under the poverty line are On Track only in zero or one domain, likely facing significant challenges as they start school. However, it is important to keep in mind that more than one in three children living under the federal poverty level are On Track in all four domains, and about one-third are On Track in three domains, which suggests that many children living at or near poverty possess skills that will serve them well as they enter school. These associations remain statistically significant when we control for parent education, child sex, race/ethnicity, and family structure.
Detailed descriptive analyses reported in Appendix C indicate that family income is associated with a child being On Track in each of the four HRTL domains individually.
Preschool children whose families report experiencing food insecurity are less likely than other preschoolers to be reported as healthy and ready to learn, even when controlling for other socio-demographic characteristics.
Previous research has found that household food insecurity, even at marginal levels, is associated with greater behavioral, academic, and emotional problems among children beginning as early as infancy.[5] For preschool children, the evidence suggests that food insecurity carries a developmental risk and is negatively associated with child attachment, mental proficiency, and cognitive assessment scores.[6] These developmental risks can affect children directly through interruptions in their nutrition but also indirectly through the influence of food insecurity on maternal depression and, in turn, parenting practices.[7]
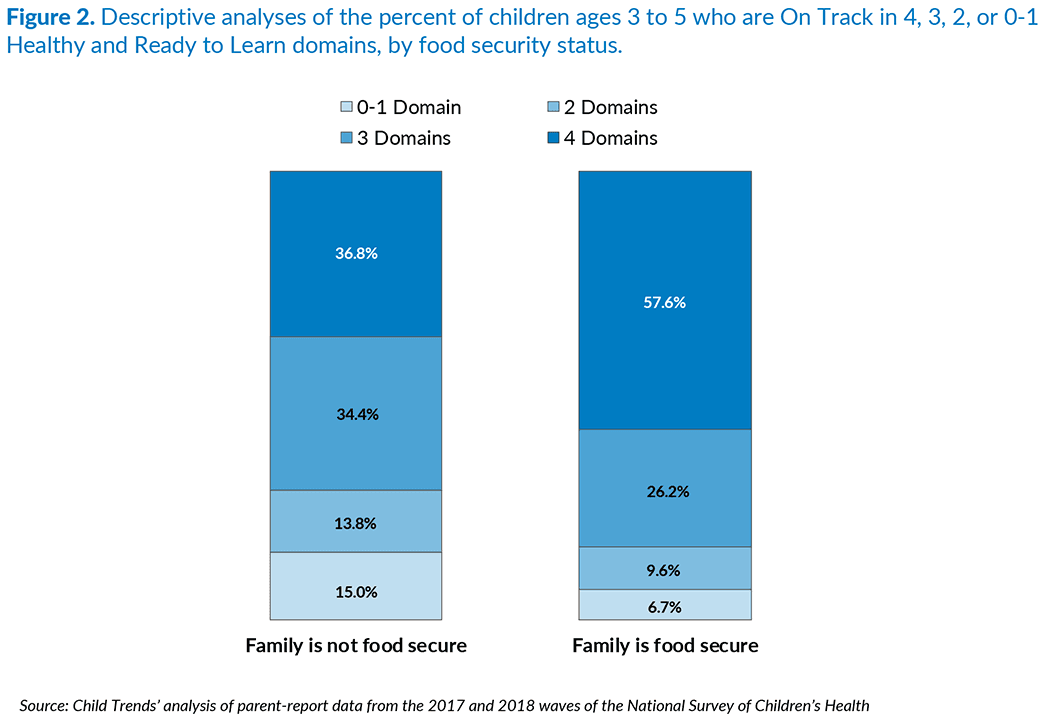
Food security is measured by the parent’s report of the family’s ability to afford and eat filling, nutritious meals. Families with food insecurity include those reporting that sometimes or often their family could not afford enough to eat. Families with food insecurity also include those reporting that they could always afford enough to eat, but could not always eat the kinds of food they should.
As shown in Figure 2, children in families reporting food insecurity were less likely to be described as healthy and ready to learn. Specifically, 37 percent of children in families reporting food insecurity were On Track in all four developmental domains, compared to 58 percent of children in families reporting food security. These associations remain statistically significant when we control for family poverty, parent education, child sex, race/ethnicity, and family structure.
Detailed descriptive analyses reported in Appendix C indicate that food security is associated with being On Track in each of the four domains individually, but the largest differences are found in the self-regulation domain.
Children whose parents report higher educational attainment are considerably more likely to be healthy and ready to learn, although this association is not significant once we control for socio-demographic differences.
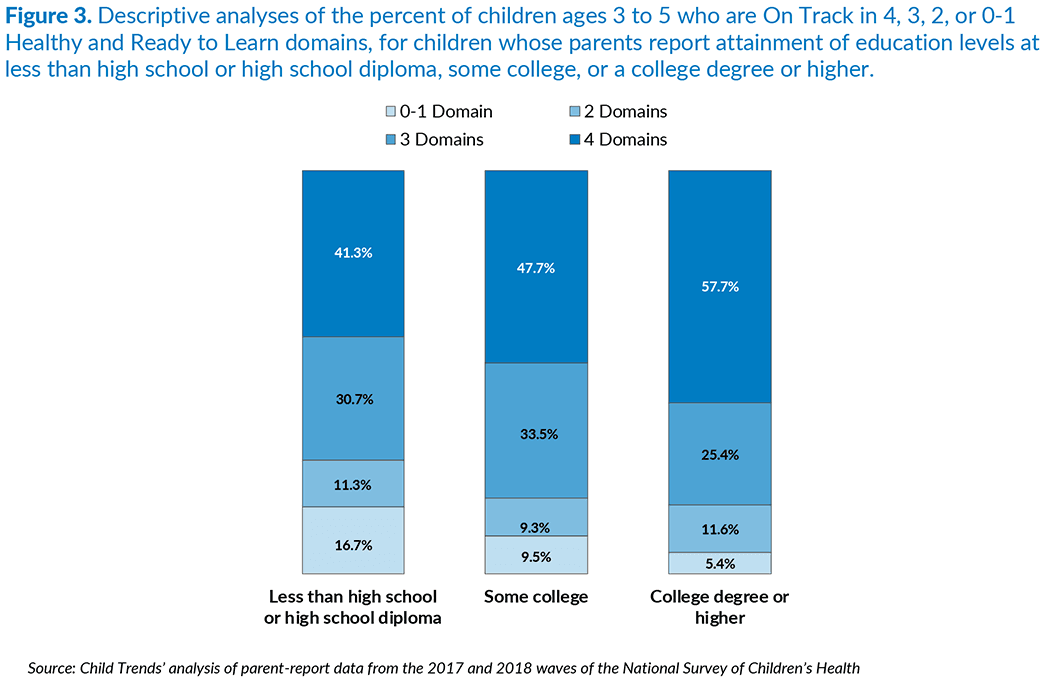
Past research suggests parents with a college education or more spend time with their children in ways that are more likely to enhance their children’s development.[8], [9] This suggests that children with more highly educated parents are more likely to be healthy and ready to learn than children of parents with lower levels of education. In the NSCH, parents reported their highest grade or level of school attained, and their responses were combined to calculate the highest level of educational attainment in the household in three levels: less than a high school degree or a high school diploma, some college education, and a college degree.
Parents with higher educational attainment are more likely to report their child as being healthy and ready to learn in all four domains than parents with lower levels of educational attainment. However, when we control for family poverty, child sex, race/ethnicity, and family structure, the association with parent education is no longer statistically significant. Further analysis reveals that parent education is strongly associated with income, which may account for the lack of a significant association once the socio-demographic factors are included in the model.
As shown in Figure 3, while 58 percent of children having at least one parent with a college degree or more are reported to be On Track in all four domains, only 41 percent of the children whose parents have a high school education or less are reported to be On Track in all four domains. Following this trend, the proportion of children who are On Track in only zero or one domain is considerably lower when at least one parent has a college degree (5 percent), compared to children whose parents’ highest level of education is high school or less (17 percent).
Detailed descriptive analyses reported in Appendix C indicate that children whose parent attained higher levels of education are more likely to be On Track in each of the four developmental domains individually.
Preschool children whose parents are married are more likely to be healthy and ready to learn, although this difference is not statistically significant once we control for socio-demographic factors.
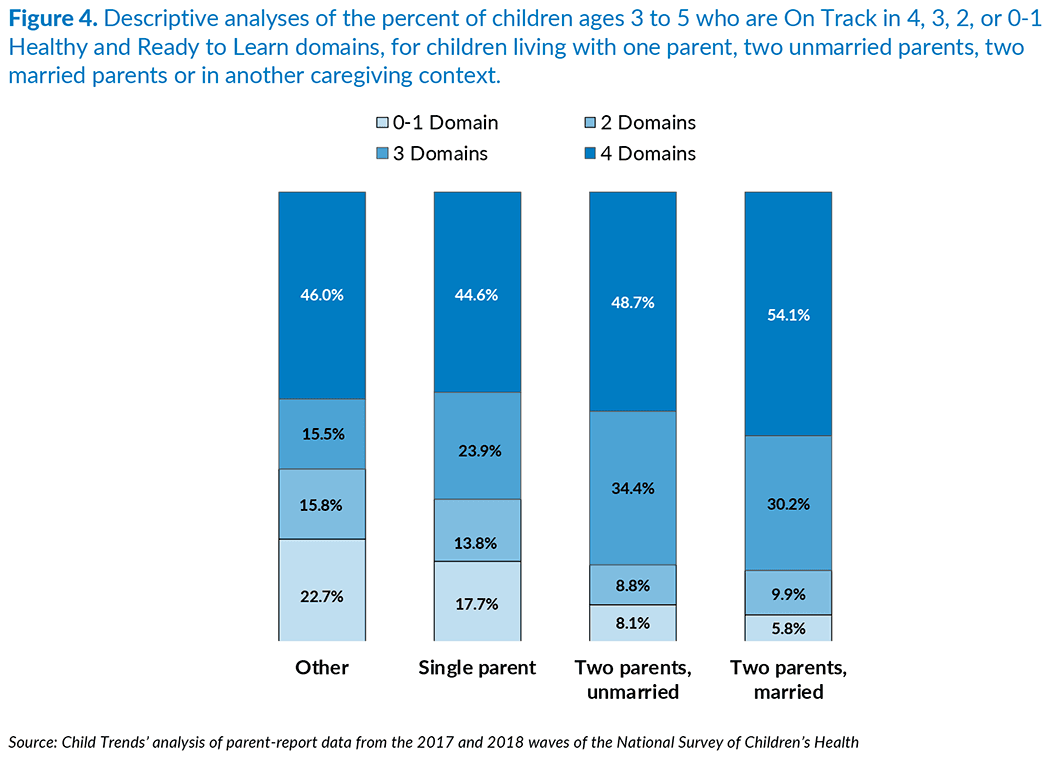
A large body of research has found that children residing in two-biological-parent married families are likely to have better outcomes than children raised in other types of families. Children do better, on average, when they live with two biological, married parents because adults who form and maintain such families usually have more economic resources and are more likely to have stable family environments.[10] Adopted children also demonstrate better outcomes in terms of their cognitive development when compared with children remaining in institutional care.[11] With data from the NSCH, we are able to examine the association between being healthy and ready to learn and family structure, organized in four categories: children living with two married parents (biological or adoptive), children living with two unmarried parents (biological or adoptive), children living with a single parent, and children living with adults in other family configurations (e.g., living with grandparents or other relatives).
As Figure 4 shows, 54 percent of preschool children living with married biological or adoptive parents are On Track in all four domains, compared with 49 percent among children living with two unmarried parents, 45 percent among children living with a single parent, and 46 percent of children living in other family configurations. However, when we control for family poverty, parent education, child sex, and race/ethnicity, this association is no longer statistically significant. Notably, children living with adults in other family relationships are significantly more likely to be On Track in only zero or one domain (23 percent), when compared to children living with married parents (6 percent).
Detailed descriptive analyses reported in Appendix C indicate that living with both parents is associated with a child being On Track in each of the four HRTL domains individually.
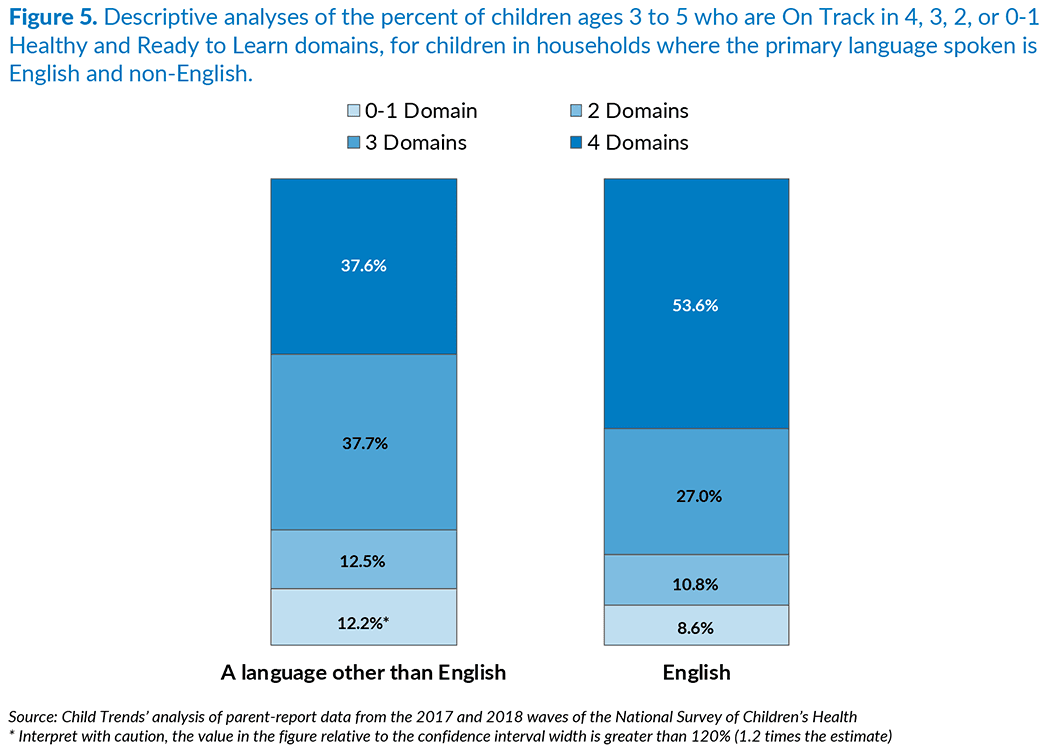
Preschool children from homes where English is the primary language were more likely to be healthy and ready to learn than those from homes with a primary language other than English, although this difference is not significant once we control for socio-demographic factors.
Research indicates that children exposed to more than one language have both advantages and disadvantages with respect to school readiness skills when compared to children with exposure to only one language. However, most studies of dual language learners fail to account for confounding socio-demographic characteristics.[12] For example, many families whose primary language is not English experience other challenges, such as lower parent education or income.[13]
Figure 5 shows that 54 percent of preschool children from homes where English is the primary language are reported to be On Track in all four domains of the HRTL measure, whereas 38 percent of preschool children from homes with a primary language other than English are reported to be On Track in all four domains. In line with the literature, when we control for family poverty, parent education, child gender, race/ethnicity, and family structure, the differences by primary home language in the proportion of children On Track in all four domains are no longer statistically significant. On the other hand, more than one in three children living in households with a primary language other than English are reported by their parents to be On Track in all four domains, and another 38 percent are reported On Track in three domains, for a total of 76 percent. This suggests that the majority of children living in homes with a primary language other than English have competencies that will support success in school.
Detailed descriptive analyses reported in Appendix C indicate that children in households where English is the primary language are On Track in each of the four developmental domains individually.
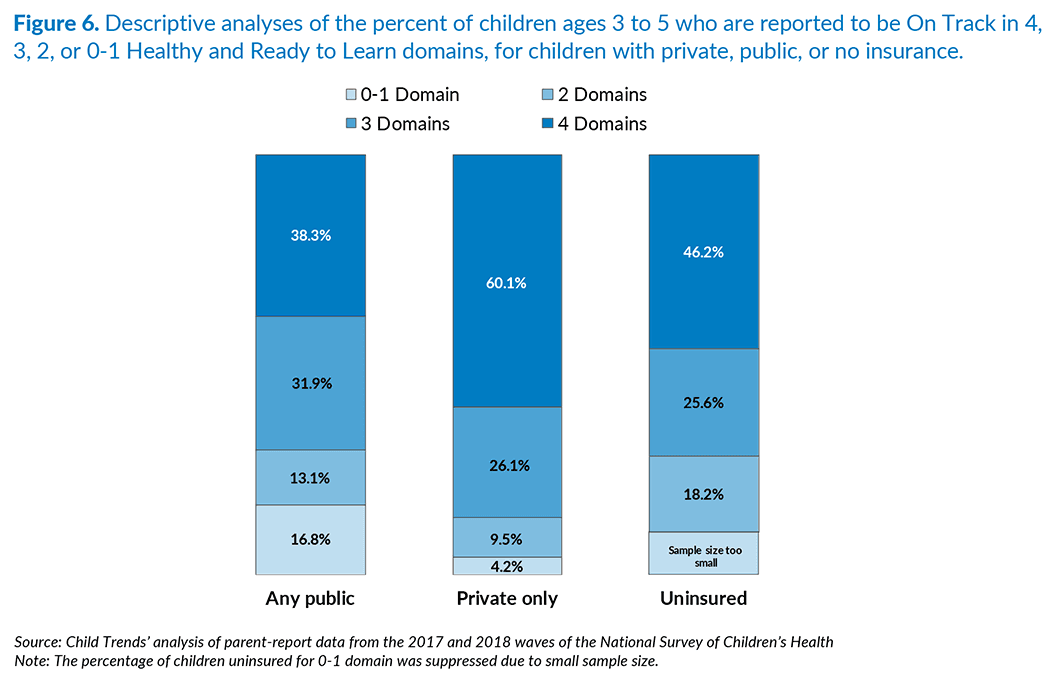
Children with private health insurance are more likely to be healthy and ready to learn compared to their peers with public or no health insurance, even when controlling for other socio-demographic characteristics.
Access to health insurance can substantially improve the health of children through increased use of health care services.[14] With data from the NSCH, we are able to examine the association between children’s health and readiness to learn and their access to health insurance, organized in three categories: children covered by private health insurance only; children covered by any public health insurance (e.g., Medicaid), even in combination with some private coverage; and children who are not insured.***
To receive the latest updates on the Kindergarten Readiness National Outcome Measure, sign up for our newsletter.
Figure 6 shows that 60 percent of children with access to private health insurance are On Track on the HRTL measure in all four domains, compared with 38 percent of children with public health insurance, and 46 percent of children whose parents report they are not insured. These differences between private health insurance and public or no health insurance are statistically significant even when controlling for other socio-demographic characteristics.
Differences in income between families with children who are not insured and families with children who are enrolled in public health insurance may explain why children who are not insured are more healthy and ready to learn than their peers accessing public insurance. In the NSCH, there is an income difference such that families with children who are not insured have higher incomes than families with children who are enrolled in public health insurance. In fact, when we control for family poverty, parent education, child sex, race/ethnicity, and family structure, the difference in the HRTL measure between children with public health insurance and those not insured is no longer statistically significant.
Detailed descriptive analyses reported in Appendix C indicate that children who have private health insurance are more likely to be On Track in each of the four developmental domains individually.
*** The proportion of children having both types is relatively small, and coding public insurance by excluding children reporting both types of insurance does not change the results.
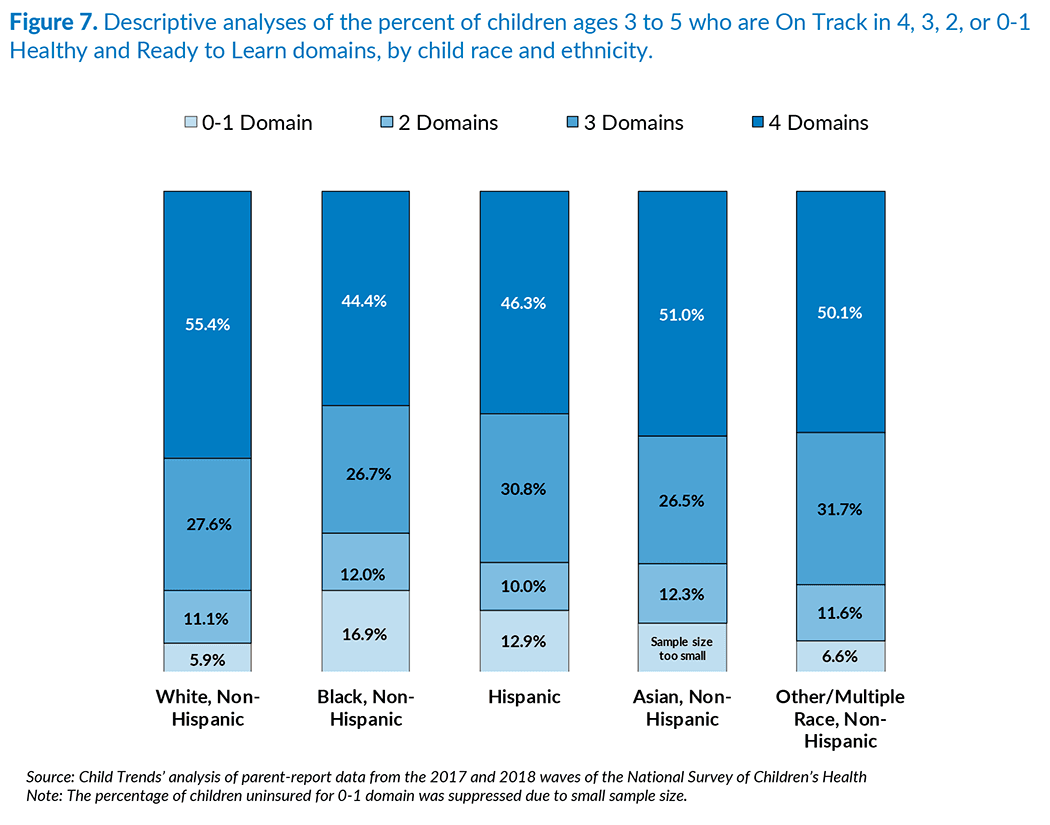
White children are more likely than Black and Hispanic children to be healthy and ready to learn, although these differences are not significant once we control for socio-demographic factors.
Black-White and Hispanic-White gaps in cognitive, social, emotional, and behavioral functioning during early childhood have been documented in the past (Halle et al., 2009).[15] Research has found that these gaps can be partially explained by socioeconomic factors.[16]
In line with previous research, we find differences in the HRTL measure by race, but most of these results are not significant net of the control variables. As shown in Figure 7, White children are more likely to be On Track across all four HRTL domains, when compared to Asian, Black, and Hispanic children. Specifically, 55 percent of White children are On Track in all four HRTL domains, while 51 percent of Asian children are On Track in all four domains. Among Black children, 44 percent are On Track in all four domains, while for Hispanic children the percentage is 46 percent. Similar to Asian children, 50 percent of children of other races and multi-race children are On Track in all four domains. However, when we control for family poverty, parent education, child sex, and family structure, the difference in the HRTL measure is not significant for Black compared with White children, nor for Hispanic children compared with White children. Only the difference in the HRTL measure between White and Asian children remains significant.
Detailed descriptive analyses reported in Appendix C indicate that White preschool children are more likely to be On Track in all four of the individual HRTL domains. Black preschool children are less likely to be On Track in each of the four domains individually, with the largest difference between Black and White children found in the socio-emotional domain of the measure.
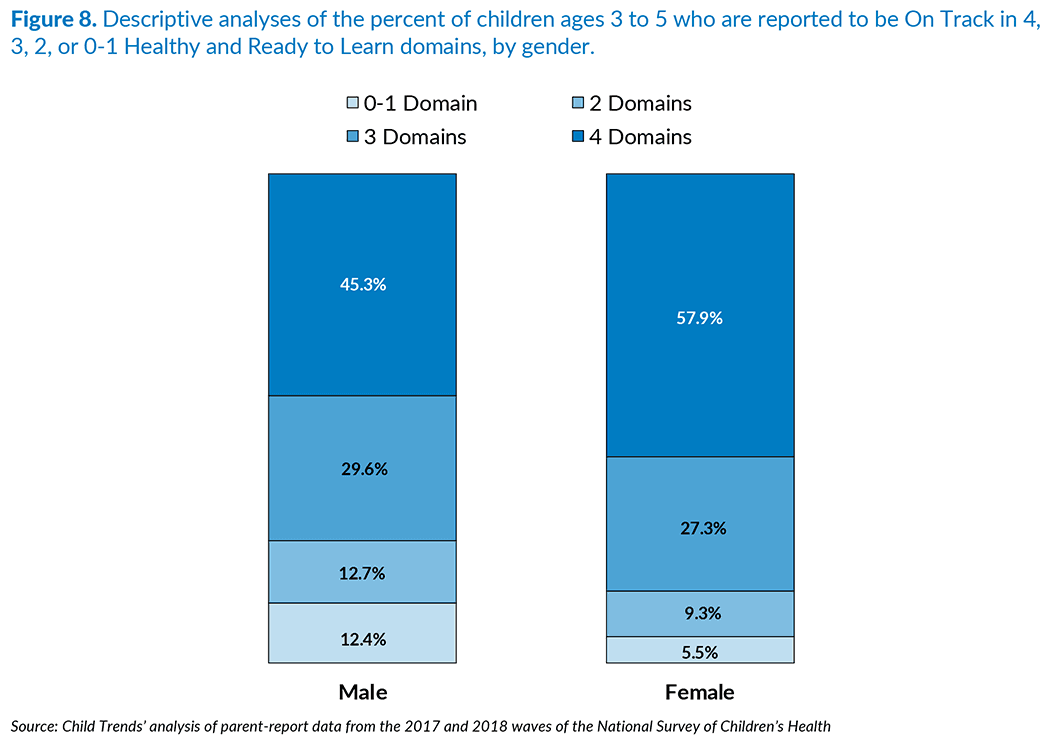
Preschool girls are more likely to be healthy and ready to learn than preschool boys, even when controlling for other socio-demographic characteristics.
Research using other nationally representative data sets has found that female children are more likely to be ready for kindergarten than their male peers.[17] Figure 8 shows that 45 percent of male children are reported by their parents to be On Track in all four domains, compared with 58 percent of female children. Preschool boys also have a greater likelihood of being On Track in zero to one or two domains when compared to preschool girls. This association remains statistically significant when we control for family poverty, parent education, race/ethnicity, and family structure.
Detailed descriptive analyses reported in Appendix C show that girls ages 3 to 5 are far more likely than boys to be reported by their parents as On Track in each individual developmental domain.
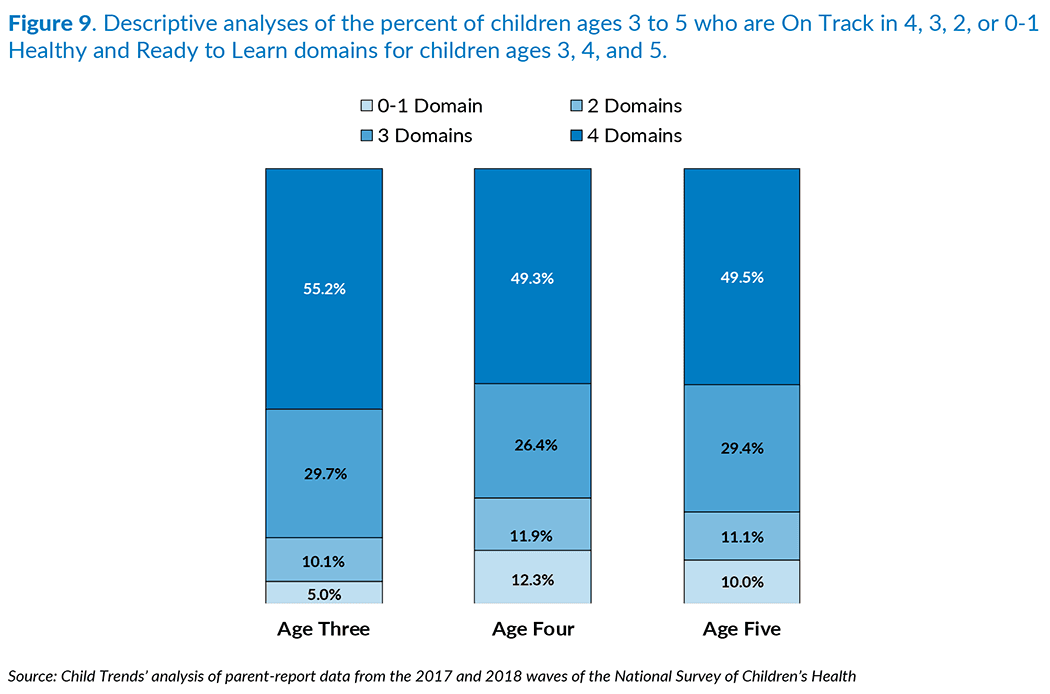
About half of 3-year old, 4-year-old, and 5-year-old children are healthy and ready to learn.
Figure 9 shows that about half of preschool children ages 3, 4, and 5 are On Track in all four HRTL domains. This similarity reflects Child Trends’ work with the Health Resources and Services Administration’s Maternal and Child Health Bureau to develop domain scales that are specific to the level of skills and behaviors appropriate for each year of age. That is, the Healthy and Ready to Learn NOM item responses were coded and scored accounting for age-specific abilities among 3- to 5-year-olds (see Appendix A for more details).
Detailed descriptive analyses reported in Appendix C indicate, however, that 3-year-olds score higher in the Early Learning Skills domain when compared to 4- and 5-year-olds. In all other domains, 3- to 5-year-olds are reported by parents to be On Track at similar proportions. The differences between 3-year-olds versus 4- and 5-year-olds remain statistically significant when we control for family poverty, parent education, child sex, race/ethnicity, and family structure.
Discussion
The social, economic, and demographic measures included in the National Survey of Children’s Health were chosen because they are known to have direct or indirect influences on children’s health and development. The question addressed in this brief is whether these social and economic factors are associated with the health and school readiness of children ages 3 to 5 as assessed in the Healthy and Ready to Learn measure.
Throughout this brief, we control for confounding differences when we describe the data in the figures depicting the overall proportion of children who are on track in all four domains. We note that some differences are not statistically significant when we control for socioeconomic factors—specifically, we control for family poverty, family structure, parent education, child sex, and race/ethnicity (i.e., when we ran regressions that include a dummy variable for each race/ethnicity subgroup: White, Black, Hispanic, Asian, and Other/Multiple Race). This means that when we account for these factors, we do not see any evidence of a relationship between school readiness and a given measure (e.g., race/ethnicity). For instance, parents of Hispanic and Black children often have lower incomes, thus having less access to resources that provide more support and stimulation to children. Therefore, when we control for income, the differences in the On Track measure between Hispanic and White, and between Black and White, children are essentially zero.
The overall patterns of findings presented in this brief align with the findings of numerous research studies. Studies generally find that children who grow up in more affluent environments where more resources and opportunities are available fare better academically.[18], [19] For instance, parents who have higher educational attainment and are married tend to have more economic resources and thus more access to academically stimulating experiences and/or access to high-quality early care and education environments.[20] Given this, we find that children whose parents report higher educational attainment are considerably more likely to be reported as healthy and ready to learn by their parents. Similarly, preschool children whose parents are married are more likely to be healthy and ready to learn. However, , education and marital status are correlated with other factors, such as income; therefore, when other socioeconomic factors are accounted for, these differences are no longer statistically significant.
A lack of access to economic resources can also influence children’s exposure to environmental stressors that may harm their development.[21] We find that preschool children whose families report experiencing food insecurity are less likely to be On Track in all four HRTL domains than their peers whose families are food secure, even when other factors are controlled.
Race/ethnicity and primary household language, however, are characteristics that do not inherently represent a problem or a direct threat to school readiness. Nevertheless, families and children who face barriers due to these characteristics are more likely to have low rates of readiness for school.[22] We found that preschool children whose home language is primarily English are more likely to be On Track in all four HRTL domains than their peers whose home language is primarily a language other than English. Also, White preschool children are more likely to be On Track in all four HRTL domains than are Black and Hispanic preschool children. These differences do not remain statistically significant after we control for other socioeconomic characteristics.
We recognize that the associations described here are correlational, and that no causal conclusions can be drawn. Furthermore, we note that the National Outcome Measure of Healthy and Ready to Learn examined here is a pilot measure that is likely to be strengthened in the coming years. Nonetheless, the kinds of associations discussed in this brief have also been found in analyses of the 2016 NSCH, using a Healthy and Ready to Learn measure that is slightly different in terms of the variables and coding of items in the measure. These patterns, therefore, appear to be very consistent. HRTL data will be available for each state and will be made available on an annual basis, as a part of the National Survey of Children’s Health.
Conclusion
To effect positive change in school readiness, policymakers and stakeholders must have a reliable way to track, over time, whether preschool children are healthy and ready to learn, and must address the structural inequities that promote disparities in school readiness. The findings presented in this brief indicate that relationships can be detected between social, demographic, and economic characteristics of the family and indicators of children’s health and readiness to learn (represented by the NOM HRTL) that are consistent with patterns found in previous research. Stakeholders can track NOM HRTL scores across subgroups of interest to determine the need for interventions and supports and to assess whether initiatives are working to promote equity in school readiness.
Given that the HRTL measure is in its pilot phase, it is possible that the exact proportions of children assessed as healthy and ready to learn may change as the measure is improved in future iterations. Nevertheless, the associations presented in this brief align with the findings of numerous research studies and suggest that, if policymakers want to improve young children’s school readiness, they can identify subgroups of interest who can benefit from interventions promoting children’s development.
Endnotes
[1] Heckman, J. J. (2008). Role of income and family influence on child outcomes. Annals of the New York Academy of Sciences, 1136(1), 307–323. https://doi.org/10.17226/25246
[2] Shankar, P., Chung, R., & Frank, D. A. (2017). Association of food insecurity with children’s behavioral, emotional, and academic outcomes: A systematic review. Journal of Developmental and Behavioral Pediatrics, 38(2), 135–150. https://doi.org/10.1097/DBP.0000000000000383
[3] National Academies of Sciences, Engineering, and Medicine. (2019). A roadmap to reducing child poverty. Washington, DC: National Academies Press.
[4] Brown, S. L. (2010). Marriage and child well-being: Research and policy perspectives. Journal of Marriage and Family, 72(5), 1059–1077. https://doi.org/10.1111/j.1741-3737.2010.00750.x
[5] Zaslow, M., Bronte-Tinkew, J., Capps, R., Horowitz, A., Moore, K. A., & Weinstein, D. (2009). Food security during infancy: Implications for attachment and mental proficiency in toddlerhood. Maternal and Child Health Journal, 13(1), 66–80. https://doi.org/10.1007/s10995-008-0329-1
[6] Shankar, P., Chung, R., & Frank, D. A. (2017). Association of food insecurity with children’s behavioral, emotional, and academic outcomes: A systematic review. Journal of Developmental and Behavioral Pediatrics, 38(2), 135–150. https://doi.org/10.1097/DBP.0000000000000383
[7] Zaslow, M., Bronte-Tinkew, J., Capps, R., Horowitz, A., Moore, K. A., & Weinstein, D. (2009). Food security during infancy: Implications for attachment and mental proficiency in toddlerhood. Maternal and Child Health Journal, 13(1), 66–80. https://doi.org/10.1007/s10995-008-0329-1
[8] Hofferth, S. L., & Sandberg, J. F. (2001). How American children spend their time. Journal of Marriage and Family, 63, 295–308. https://doi.org/10.1111/j.1741-3737.2001.00295.x
[9] Guryan, J., Hurst, E., & Kearney, M. (2008). Parental education and parental time with children. Journal of Economic Perspectives, 22(3), 23–46. https://doi.org/10.1257/jep.22.3.23
[10] Brown, S. L. (2010). Marriage and child well-being: Research and policy perspectives. Journal of Marriage and Family, 72(5), 1059–1077. https://doi.org/10.1111/j.1741-3737.2010.00750.x
[11] van Ijzendoorn, M. H., Juffer, F., & Poelhuis, C. W. K. (2005). Adoption and cognitive development: A meta-analytic comparison of adopted and nonadopted children’s IQ and school performance. Psychological Bulletin, 131(2), 301-316. https://doi.org/10.1037/0033-2909.131.2.301
[12] Halle, T., Castro, D., Franco, X., McSwiggan, M., Hair, E., &Wandner, L.(2011). The role of early care and education in the development of young Latino dual language learners. In N. Cabrera, F. A. Villarruel, & H. E. Fitzgerald (Eds.), Latina and Latino children and mental health: Volume I: Development and context (pp. 63–90). Santa Barbara, CA: Praeger.
[13] Winsler, A., Kim, Y. K., & Richard, E. R. (2014). Socio-emotional skills, behavior problems, and Spanish competence predict the acquisition of English among English language learners in poverty. Developmental Psychology, 50(9), 2242-2254. https://doi.org/10.1037/a0037161
[14] Levy, H., & Meltzer, D. (2008). The impact of health insurance on health. Annual Review of Public Health, 29, 399-409. https://doi.org/10.1146/annurev.publhealth.28.021406.144042
[15] Halle, T., Forry, N., Hair, E., Perper, K., Wandner, L., Wessel, J., & Vick, J. (2009). Disparities in early learning and development: lessons from the Early Childhood Longitudinal Study–Birth Cohort (ECLS-B). Washington, DC: Child Trends.
[16] Heckman, J. J. (2008). Role of income and family influence on child outcomes. Annals of the New York Academy of Sciences, 1136(1), 307–323. https://doi.org/10.1196/annals.1425.031
[17] Halle, T., Forry, N., Hair, E., Perper, K., Wandner, L., Wessel, J., & Vick, J. (2009). Disparities in early learning and development: lessons from the Early Childhood Longitudinal Study–Birth Cohort (ECLS-B). Washington, DC: Child Trends.
[18] Heckman, J. J. (2008). Role of income and family influence on child outcomes. Annals of the New York Academy of Sciences, 1136(1), 307–323. https://doi.org/10.1196/annals.1425.031
[19] National Academies of Sciences, Engineering, and Medicine. (2019). A roadmap to reducing child poverty. Washington, DC: National Academies Press.
[20] Isaacs, J., & Magnuson, K. (2011). Income and education as predictors of children’s school readiness. Washington, DC: Brookings Institution.
[21] DeCarlo Santiago, C., Wadsworth, M. E., & Stump, J. (2011). Socioeconomic status, neighborhood disadvantage, and poverty-related stress: Prospective effects on psychological syndromes among diverse low-income families. Journal of Economic Psychology, 32(2), 218–230. https://doi.org/10.1016/j.joep.2009.10.008
[22] Halle, T., Forry, N., Hair, E., Perper, K., Wandner, L., Wessel, J., & Vick, J. (2009). Disparities in early learning and development: lessons from the Early Childhood Longitudinal Study–Birth Cohort (ECLS-B). Washington, DC: Child Trends.