


Measuring kindergarten readiness is essential to identifying children who would benefit from additional supports, either in kindergarten or in the years before kindergarten entry. Several measures of kindergarten readiness are in use now by states and researchers. Most assess individual children at the time they enter kindergarten, using teachers and/or child development specialists as assessors. In contrast, a new measure, still in the pilot phase, measures children in the aggregate in the years before they enter kindergarten (ages 3, 4, and 5), using parent responses to the National Survey of Children’s Health.
This brief is one in a series exploring the pilot measure, known as the Healthy and Ready to Learn (HRTL) National Outcome Measure (NOM). National Outcome Measures (NOMs) cross all population domains and reflect maternal and child population health status. More than two dozen NOMs have been developed and are tracked and reported by the Health Resources and Services Administration’s Maternal and Child Health Bureau (HRSA MCHB) at the national and state levels.
This particular brief reviews the current status of and evidence for the HRTL measure developed as a proposed National Outcome Measure (NOM) for the federal Title V Maternal and Child Health Services Block Grant, and compares it with other well-being and readiness measures. Its purpose is to aid researchers, policymakers, and early childhood advocates in understanding the utility of the new HRTL measure, by itself and in conjunction with other measures of kindergarten readiness. The brief also aims to facilitate appropriate interpretation of future findings from the HRTL measure and recommends next steps in the development of the measure.
Key takeaways
- The Healthy and Ready to Learn (HRTL) measure is a parent-report population-level indicator for children ages 3 to 5 designed to track trends in development over time across multiple domains and competencies. This purpose makes the measure distinct from other measures of children’s well-being and/or development, such as developmental screening tools, and from measures of kindergarten readiness administered at kindergarten entry.
- The HRTL measure is derived from a set of items included on the National Survey of Children’s Health (NSCH). The NSCH is an annual survey funded and directed by the Health Resources and Services Administration’s Maternal and Child Health Bureau, and is designed to provide national and state-level estimates of key measures of child health and well-being—as well as measures of the child’s family, social, and economic context—yielding unique benefits for understanding the context of school readiness and healthy development.
- Once refined, state-level estimates can be generated regularly, allowing state policymakers to use HRTL data to understand the status of young children in their community.
- Data from the Healthy and Ready to Learn measure can be viewed in concert with other state and national data from a variety of available data sources, such as population health indicators, kindergarten entry/readiness data, and statewide early childhood or family program evaluation outcome data.
- Healthy and Ready to Learn is a pilot measure and requires additional validity work (e.g., predicting later academic skills) before its full promise can be realized.
- The pilot data indicate that the measure detects expected patterns in school readiness. Specifically, we examined how being healthy and ready to learn correlates with demographic, child, and family-level characteristics, such as parental education, neighborhood disadvantage, parental mental health, adverse childhood experiences, amount of sleep, and frequency of shared book-reading. Findings suggest that these characteristics covaried with the measure as expected, and the measure yields percentages of children On Track for readiness similar to percentages of children meeting expectations on state kindergarten readiness/entrance assessments.[1]
Introduction
Children’s health, along with the pre-academic, social-emotional, self-regulation, and motor skills they gain before kindergarten entry, can greatly affect their ability to succeed in school and later in life.[2] Consequently, states and communities have a vested interest in providing resources to support young children as a way to promote healthy developmental trajectories. Policymakers and researchers need access to reliable and robust child well-being measurement tools in order to determine the health and developmental status of preschool-aged children in their states; this need is particularly salient to policymakers in states making strategic investments in young children and families from the prenatal period through school entry. Currently, limited data on the development of young children are available prior to kindergarten entry. Only a handful of states annually collect data that can indicate the readiness and well-being of young children across the state and by subpopulation, particularly for three- and four-year olds. Thus, a valid tool that captures all preschoolers’ development at the national, state, or local level is a critical resource for local and state policymakers, early childhood investors and advocates, school superintendents, public health agency officials, and community leaders.
The National Outcome Measure (NOM) of Healthy and Ready to Learn National Outcome Measure (HRTL) was developed by the Health Resources and Services Administration’s Maternal and Child Health Bureau (HRSA MCHB), in collaboration with Child Trends, to meet this need. The HRTL measure is comprised of a collection of items added to the National Survey of Children’s Health (NSCH) beginning in 2016; the NSCH is a nationally representative annual household survey. Currently, the HRTL measure is in its pilot phase, meaning that items are still being added or revised. The first pilot measure of HRTL was developed using 18 items embedded in the 2016 NSCH; when a 19th item on school readiness was added to the NSCH in 2017, this item was included in the second version of the pilot measure of HRTL. (For more information on the details of the measure, including the history of the measure, items, and domains, see Appendix A.) Additional questions and revisions to existing questions continue to be considered for inclusion in the survey, and thus, for inclusion in the HRTL measure; this work is informed by a panel of experts comprised of stakeholders at the national and state levels.
The Purpose of Healthy and Ready to Learn
As more communities, states, and philanthropists invest in young children and their families during the earliest years of life, there is a critical need for measures of well-being and school readiness that indicate how young children are faring at the local, state, and national levels. The HRL measure was not designed to replace current measures of child development, well-being, or kindergarten readiness; rather, the measure is intended to fill a gap in understanding of children’s development and school readiness from ages 3 to 5, during the years prior to kindergarten entry.
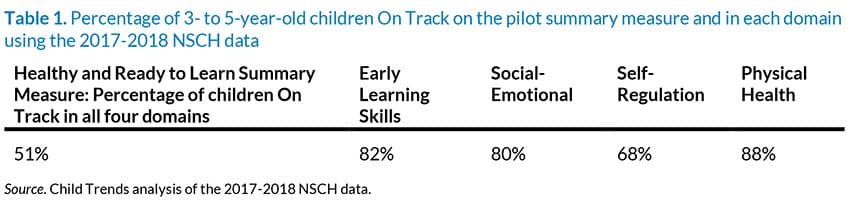
The HRTL measure includes questions from the NSCH that are specific to parents of children ages 3 to 5, concerning four domains of development: early learning skills (e.g., math, expressive language, literacy), social-emotional development, self-regulation skills, and physical health and motor development, (For the items in each domain, see Appendix Table A1). Thus, the HRTL measure is designed to serve as multidimensional “whole-child” assessment. It yields a score for each domain, and a summary score across all four domains; scores are categorized into three levels: Needs Support, Emerging, and On Track. For more information on the development of the measure, please visit the HRTL description and FAQ page and a recent publication on the 2016 pilot measure.[3]
The HRTL measure offers the following benefits to the public, policymakers, and early childhood and K-12 stakeholders:
- Describing children’s readiness for school in the years leading up to kindergarten entry at the state and national levels with a standardized measure
- Identifying subgroups of children who are less likely to be On Track for school readiness in order to inform program and policy decisions, again at the state and national levels
- Forming the basis for tracking trends over time to assess progress toward the goal of ensuring that all children are ready for school, and assessing how state policies impact trends in school readiness
Ongoing validation work has continued with the 2017 and 2018 NSCH, including the addition of new items to the survey, and subsequently to the measure. The measure requires additional pilot testing to establish validity (meaning the degree to which the tool measures what it is intended to measure in the real world).
The HRTL measure is unique in several ways:
- It is designed to provide population-level information on early childhood development and well-being to policymakers, researchers, and early childhood stakeholders. Currently, there is little information on 3- to 5-year-olds’ readiness for school at the state or national level.
- It is collected annually, which allows for tracking changes in rates of healthy and ready to learn over time.
- It can examine children’s health and readiness to learn in the context of health, family, social, and economic factors.
- It is distinct from other measures of children’s well-being and school readiness; for example, the fact that the HRTL is a parent-report measure sets it apart. In addition, the NOM is a criterion-based readiness measure, while many other development and readiness measures are norm-based.
- The data from the HRTL measure can be interpreted in concert with other data, including public health and census data (e.g., low birth weight rates, poverty rates), as well as kindergarten entry/readiness assessment data collected on older children.
To appropriately interpret findings from the HRTL measure, it is important to understand the unique properties and features that distinguish it from other measures. This brief provides key information regarding the similarities and differences between this measure of HRTL and other measures of school readiness and well-being to help ensure appropriate interpretation of the measure in the future. We begin by describing what we have learned so far from the HRTL pilot measures, which were developed with the 2016 NSCH data and refined with the 2017-2018 data.
Healthy and Ready to Learn: What We Know to Date from the Pilot Measures
Findings from the 2016 pilot measure suggested that 42 percent of 3- to 5-year-old children were On Track for school readiness in four domains of development: early learning skills, social-emotional development, self-regulation skills, and physical health and motor development. In addition, 34 percent were On Track in three domains, while 15 percent were On Track in two and only 9 percent were On Track in zero or one domain.[3] Findings from a paper under review indicate that a wide variety of measures of disadvantages experienced by the child and the family, including community contexts, are strongly associated with scores on the HRTL measure.[1]
In consultation with an expert panel and Child Trends, HRSA MCHB made changes between the 2016 pilot measure and the 2017-2018 pilot measure. These changes included modifications to items, such as changes to response options and question wording. Also, several items were dropped and new items were added to the Early Learning Skills, Physical Health (the motor item was dropped, changing this domain, for the 2017-2018 pilot, to only include physical health items), and Self-Regulation domains. Finally, several changes were made in how the individual items and domains were coded to determine designations of Needs Support, Emerging, and On Track. These changes, collectively, advanced the measure and were likely responsible for changes to the final estimates of children reported as On Track in each domain and across domains. Using data across two years of the NSCH, Child Trends analyzed the 2017-2018 pilot measure, and findings are summarized in Table 1. In addition, the HRTL measure is strongly associated in expected directions with several contextual variables, including parental education, number of adverse childhood experiences, reports of parenting strengths, and neighborhood risks and amenities. These findings are summarized in companion briefs forthcoming on Child Trends' website.
Utility of Healthy and Ready to Learn for policymakers
The HRTL measure will be a useful indicator of child well-being for policymakers and stakeholders once pilot testing is complete. In the future, estimates can be generated at the state level on an annual or bi-annual basis depending on sample size and analytic needs, allowing policymakers to use HRTL data to understand the status of young children in their state and across the nation. These estimates can also inform state and national efforts to improve children’s readiness for school in the years prior to kindergarten. Furthermore, states can purchase oversampling,[4] which can allow for estimation of substate estimates on an annual or bi-annual basis, yielding community-specific estimates of HRTL.
To receive the latest updates on the Kindergarten Readiness National Outcome Measure, sign up for our newsletter.
As an indicator of well-being, the HRTL measure is designed to provide population-level information, to be short and simple to complete, to be appropriate for diverse subpopulations, and to draw on theory and research. As such, it shares some similarities with other measures of well-being and school readiness. However, if stakeholders compare data from the HRTL measure with data from other measures of well-being or school readiness, they may wonder why estimates between measures differ, and whether the measures are conveying the same information. The following sections detail potential sources of differences between the HRTL measure and other measures of child development, well-being, and school readiness to inform appropriate interpretation of the HRTL measure.
Comparing Healthy and Ready to Learn to Other Measures
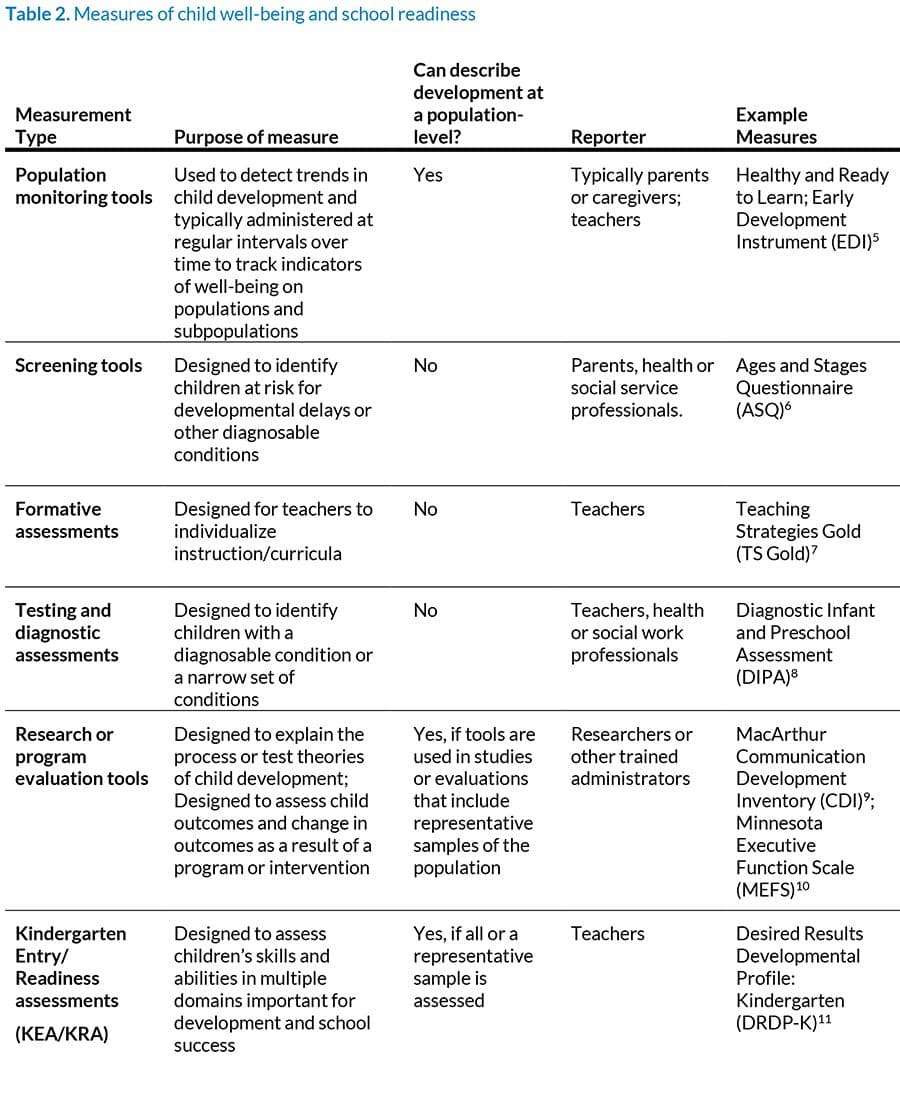
Measures of early childhood development, well-being, and school readiness vary in their purposes; these goals drive many features of a given measure, as well as appropriate interpretation. For example, population monitoring tools are social indicators designed to detect trends in populations and subpopulations. In contrast, screening tools include items about discrete behaviors, so that conclusions may be drawn about whether a child needs further assessment and/or treatment. Data from measures designed for different purposes can provide complementary, but not necessarily overlapping information. In Table 2, we summarize different kinds of measures of early childhood well-being and school readiness by purpose, and highlight that screening tools, formative assessments, and diagnostic tools are not designed to describe development and school readiness at the population level. In the following sections, we compare the HRTL measure to other measures that can describe development at a population level, as only the data from these measures can serve as appropriate comparisons to data from the HRTL measure.
Comparing the HRTL measure to other population-monitoring tools
The HRTL measure provides a population-level, multidimensional portrait of “whole-child” development among children ages 3 to 5. It is designed as a population-level monitoring tool, which is a type of measurement tool intended to describe indicators of health and development at various levels of geographic and/or demographic characteristics. Population measures are used to describe groups sharing a specific characteristic, such as children living in a city, county, state, or nation, or children in low-income households. Subgroup analyses, including analyses by child demographic or geographic characteristics, are feasible and appropriate. Monitoring tools collect data at regular intervals; the HRTL measure is collected annually on a nationally representative sample of 3- to 5-year-olds. The HRTL measure, then, is a population monitoring tool designed to monitor child development and school readiness at the national and state level. In the future, community-level (e.g., city- or county-wide) data could be collected using this measure (either through purchasing oversampling of the NSCH, or through community-initiated data collection efforts), yielding community-specific population-level estimates of children’s school readiness from ages 3 to 5.
Other early childhood population monitoring tools
There are currently two population monitoring tools for children ages 0 to 3: the short form Caregiver Reported Early Development Instruments (CREDI),[12] and a new measure under development known as the Global Scales for Early Development (GSED).[13] These two tools are similar to the HRTL measure in that they are short, parent-reported measures of early development covering cognitive, language, motor, social-emotional, and self-regulatory skills. The CREDI has been used in the United States and around the world but is not currently in wide use at a population level within the United States. The GSED is currently being pilot tested in one U.S. city; future plans for population-level data collection within the United States are still being determined.
Information from the CREDI and the GSED, including estimates of child development, should be similar to estimates generated by the HRTL measure; however, two key aspects of the measures pose problems for comparing their data. First, the measures’ age ranges differ, with the CREDI and GSED overlapping with the HRTL measure only at age 3. Second, the measures report a child’s developmental progress in different ways. The GSED calculates a single score of child development, while the HRTL measure estimates the percentage of children On Track for school readiness in four domains and overall. The CREDI currently estimates a single continuous score of development, and the measure’s developers are working to determine a threshold at which a child can be considered On Track. The implications from each measure are quite similar—each can indicate the percentage of children who need more support, and the percentage who are likely On Track developmentally and in terms of school readiness. However, the exact percentages of children On Track likely would differ due to number of items, scoring differences, differences in and distributions of item foci, wording and response options, and age differences. Currently, there are no data from the GSED or the CREDI that can be compared to the HRTL measure, because neither the GSED or CREDI is collected at a state or population level.
There also exists a population level monitoring tool for children ages 5 to 6, The Early Development Instrument, or EDI.[5] The EDI is a teacher-reported measure completed during the second half of the kindergarten year. Like the HRTL measure, it tracks the percentage of children On Track in terms of school readiness, can be used to identify subgroups performing better or worse in terms of school readiness, and can track trends in school readiness over time. EDI is currently in wide use in several school districts and counties within the United States, although data are usually reported at the census tract level. No formal examinations of similarities between the EDI and the HRTL measure have been undertaken, including comparison of items or percentages of children scoring On Track, although the two measures should provide similar information regarding patterns in the groups of children On Track for school readiness among 5 year olds. There are, however, important reasons why estimates may vary. The estimates may vary due to differences in reporter and setting (i.e., parents and homes versus teachers and classrooms), in addition to differences in scoring procedures, item text and response options, and child age. In addition, school entry may represent a time to intervene for young children who are identified as falling behind, and thus, children needing support may receive support, resulting in differences in the percentage found to be On Track with the HRTL measure and the EDI.
Comparing the HRTL measure to evaluation tools or kindergarten entry/readiness assessments
As shown in Table 2, several types of measures of child well-being and development are not appropriate for comparison with the HRTL measure because they cannot provide information on development at a population level. However, both evaluation tools and assessments of kindergarten readiness can provide population-level data that can be interpreted jointly with data from the HRTL measure to create a more thorough portrait of the developmental health and well-being of young children in a given state or across subpopulations in the United States. The next section details the similarities and differences between the HRTL measure and program evaluation tools and kindergarten entrance/readiness assessments.
Tools used in program evaluation or research on child development
Tools designed to test theories of human development, such as the ways in which language development is linked to the family context, are generally more specific and sensitive than a population monitoring tool, such as the HRTL measure. These types of tools, which are used in research and sometimes also in program evaluation studies, are not often administered at a population level, with the exception of large-scale, nationally representative studies that occur every 5 to 10 years, such as the Early Childhood Longitudinal Studies.[14] Data from local, state, or national evaluation or research studies can be viewed and interpreted jointly with data from HRTL as, together, they can provide a more comprehensive picture of child development and school readiness in a particular state or nationally. For instance, trends in school readiness at a state level can be compared across various state program evaluation outcomes.
Comparing kindergarten entry/readiness assessments and the HRTL pilot measure
Many states employ kindergarten entrance or readiness assessments (KEAs/KRAs), which teachers complete during the kindergarten year. KEAs/KRAs are designed to provide teachers with information regarding the developmental skills of individual children and/or the children in their classroom generally. KEAs/KRAs vary in the domains they cover, with many focused on pre-academic skills only. Not all states employ assessments that can be aggregated at the state level; even among those that do, some rely on formative assessments (such as Teaching Strategies Gold),[7] which are designed to inform instruction rather than track group trends in children’s readiness. A handful of states use KEAs/KRAs assessments designed to annually track school readiness in aggregate at the district and state level. Measures in these states, especially state assessments that can be disaggregated into different developmental domains, are useful comparisons to the HRTL measure. It is worth noting that while the EDI is also a kindergarten readiness measure, it is more similar to HRTL than KEAs/KRAs because it is a holistic measure of development and designed for population-level monitoring of development rather than identifying the skills and development of children individually; however, EDI data are currently not collected, aggregated, or reported at the state level like KEA/KRA data.
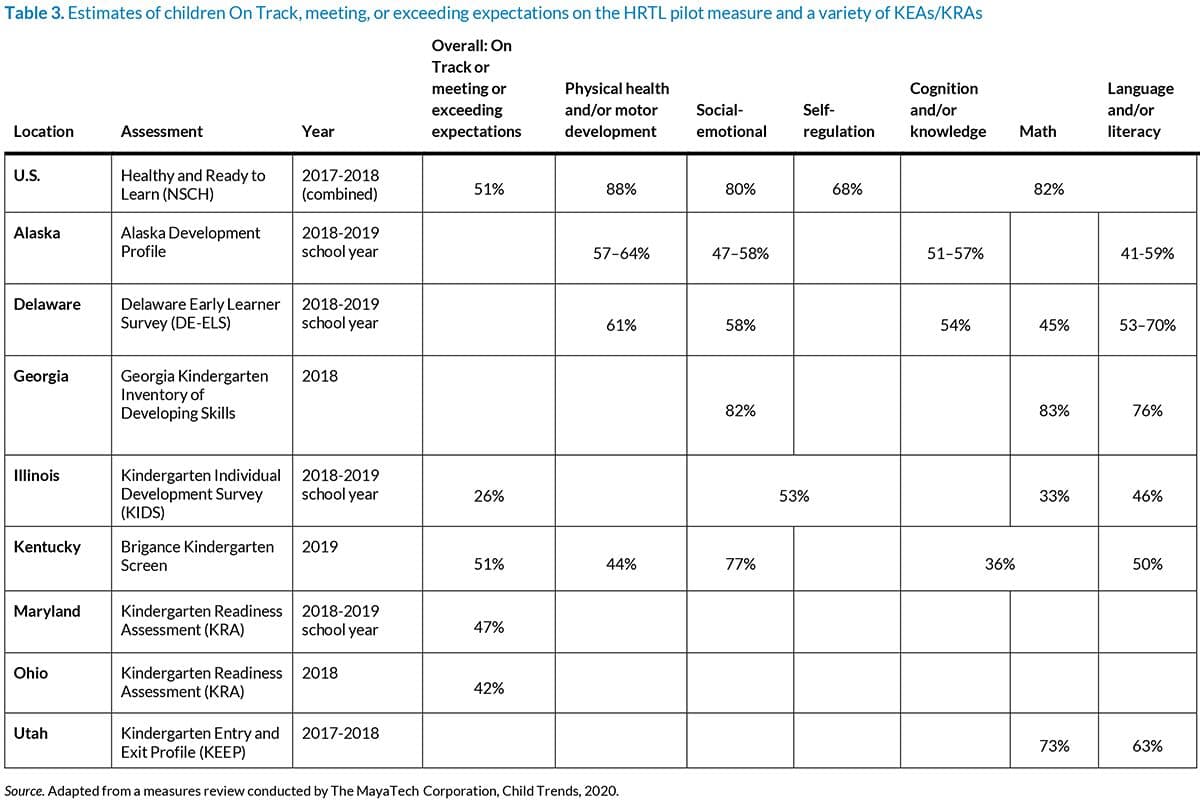
Table 3 compares estimates from the HRTL 2017-2018 pilot measure to estimates from seven states’ KEAs/KRAs. We include data from states that met the following criteria: The assessments used were appropriate for generating statewide estimates of school readiness (i.e., data is from all districts), and the assessment data were from 2017 or later. The table indicates whether the percentage of young children ages 3 to 5 found to be On Track for school readiness on the HRTL measure is comparable to the estimate of kindergarteners found to be meeting or exceeding expectations on each state’s KEA/KRA.
In general, we find substantial variation among the KEAs/KRAs in terms of both the percentage of children meeting or exceeding expectations overall, and the percentage in particular domains. These differences likely stem from differences between items that are grouped within similarly named constructs, meaning that the exact skills assessed under one assessment’s domain of social-emotional development may differ from another assessment’s domain for such skills. Furthermore, we would not expect every state to have the same proportion of kindergarteners meeting or exceeding expectations.
Assessments that calculate overall scores of On Track or meeting expectations for school range from 26 to 51 percent, which is similar to the 2017-2018 HRTL pilot measure’s estimate of 51 percent (the 2016 HRTL pilot measure’s estimate was 42%).[15] Estimates from the domains of HRTL tend to be higher than most kindergarten entry or readiness assessments but are in line with the assessment used in Georgia.
The HRTL measure should yield estimates of school readiness similar to those from state kindergarten readiness/entrance assessments; it was developed, in part, to allow state education administrators to use the HRTL data to understand the readiness of children they will soon serve in their kindergarten and elementary school programs. Therefore, we should try to understand the differences between the data from HRTL and KEAs/KRAs and, in particular, consider why the 2017-18 HRTL pilot estimates seem to be higher. There are many sources of differences:
- Teachers and parents have different perspectives on individual children. Teachers and parents observe children in different environments. A parent may have more opportunities to observe their child’s behaviors and to see their social-emotional and self-regulation skills across contexts. Teachers, however, likely have more experience with young children, generally, than parents, which informs their perspective on what is typical or expected at certain ages. In addition, teachers’ assessment of children’s skills within an educational context may be more directly relevant to measuring readiness, or potential for school success.
- Teachers and parents report on development differently. Teachers and parents differ in their perceptions of what constitutes school readiness.[16], [17] Research suggests that with respect to clinical levels of children’s social-emotional or self-regulation difficulties, parents report more types and greater severity of difficulties than teachers report.[18] In addition, research has found that parents not only tend to report more problems, but that parents and teachers have different constructs of children’s behavior problems and social skills.[19] Less is known about the similarities and differences between parent and teacher reports of pre-academic skills or health and motor development.
- Some developmental skills may vary across context. Some skills, such as gross or fine motor skills, likely do not vary across the home and school context; however, social-emotional and self-regulation skills may vary quite a bit across these settings.
- Differences in exact item wording and scoring. Assessments may vary in their item wording, response options, and how they are scored. Differences in item wording can lead to slightly different skills being evaluated across assessments, and differences in scoring can yield different estimates of readiness. In addition, KEAs/KRAs differ across states because they are designed to assess children’s readiness based on the state’s early learning standards and definition of school readiness.
- Differences in how the skills are organized into domains. No state’s KEA/KRA includes a domain labeled “Self-Regulation” as the HRTL measure does, but items about self-regulation skills are often captured under domains labeled “Social” or “Social-Emotional.” In addition, some states measure “Self-Help” skills, which include fine motor skills, such as dressing, and self-regulation skills.
- Differences in the samples used to generate estimates of readiness. Estimates of readiness from states included in Table 3 were based on data pooled across public schools in each state, so the data are typically not inclusive of children in private kindergartens or children who do not attend school. Estimates of readiness from the HRTL measure are drawn from data that sample from young children across the nation; the data are then weighted to represent young children ages 3 to 5 in the United States and in each state. Thus, estimates of HRTL at the national or state level are meant to represent estimates of all children in that age group, regardless of school enrollment, while data from state KEAs/KRAs are based on young children enrolled in kindergarten.
If states are to compare what they learn from KEAs/KRAs to what is available in the HRTL measure, they should compare the types of questions asked, how they are scored, the sample of children who are assessed (e.g., all children in the state, or only children in particular types of programs), and how thresholds for being On Track are determined and interpreted, for their current KEA/KRA versus HRTL. So far, a comparison of the estimates suggests that the HRTL measure produces fairly similar, albeit often higher, estimates of the number of children who are On Track compared to existing KEAs/KRAs. The HRTL measure is still a pilot, and changes will be made to included items, response options, and how items and domains are coded. As the measure is updated, we will continue to track similarities and differences in estimates with state assessments.
The Healthy and Ready to Learn Measure Has Unique Characteristics Due to Its Placement in the NSCH
The HRTL measure is designed to be an indicator of early childhood health and well-being that is tracked annually within the NSCH. Its placement within the NSCH gives the measure unique characteristics; some of these provide advantages over other measures used to assess school readiness, while others reflect some constraints. Understanding these characteristics can help researchers and policymakers who may use HRTL estimates to make recommendations and decisions.
First, the measure’s placement within the NSCH is advantageous because this makes it possible to triangulate estimates of the HRTL with the rich contextual and child health information available in the annual survey. For instance, as described in companion briefs (forthcoming in 2020), it is possible to understand how HRTL scores vary by several child, family, community, and demographic characteristics, as well as by geographic area such as state, urbanicity, or region. Assessments collected at the population level that can be interpreted in light of such rich child-level characteristics are few, thus, the measure’s placement in the NSCH can contribute substantially to our understanding of young children at the population-level. Data from population-level assessments, such as HRTL, can be interpreted in light of census, or other population-level, information.
A second advantage of the HRTL measure’s placement is that the data from the NSCH are made freely and openly available less than 10 months after they are collected. Thus, release of the measure’s estimates will be timely for policy making and early childhood systems-building efforts. Moreover, the measure, once completed, will be freely available, allowing cities or counties to use the measure to collect their own population-level data.
Along with these advantages, other characteristics of the HRTL measure reflect constraints necessitated by its placement in the NSCH. Specifically, the HRTL measure is intended to be simple for parents of varying cultural and educational backgrounds to understand and complete in a short amount of time. All of these considerations are particularly important because the measure is embedded within a larger survey; that is, since surveys that are short and easy to complete are more likely to be completed, the HRTL measure must take up as little time and room in the NSCH as possible. Thus, the HRTL measure has several characteristics that improve its efficiency. For example, each item is designed to be clear and brief, and response options are similar if not identical across items. This reduces the amount of time it takes to answer a series of questions. In addition, each item is designed to be as culturally neutral as possible, and interpreted the same way by all parents. The NSCH is also unlike measures that are completed with the assistance of a professional or measures that include visual depictions of skills (e.g., a picture of a child climbing stairs, with one foot on a higher step than the other foot). Furthermore, the scope of the measure’s items must be limited to behaviors and skills on which parents can report without needing to ask their child to perform the skill or behavior; if a parent had to take time to ask their child to draw a circle or recite a rhyme, this would decrease the chances that they would complete the survey. Given the simplicity and brevity of the measure, it is not designed to provide detailed information on individual child development, but is best poised to serve as a parent-reported indicator of readiness, at a broad level.
Another unique characteristic of the HRTL measure is that it asks parents of children ages 3 to 5 to answer the same items. Response options are coded differently by child age, meaning that 3-year-olds are expected to perform skills and behaviors at different levels than 4- and 5-year-olds; thus, different response options can signal that a child’s development is On Track based on their age. However, this constraint means that questions and response options must be broad enough to cover the wide age range of 36 to 72 months, which is uncommon compared with other measures of children’s development and well-being. This, again, is a constraint of the short, parent-report design of the NSCH, which does not allow for single-age-specific questions. In addition, the exact age of the child in months is not collected in the NSCH.
Recommendations for Advancing the Healthy and Ready to Learn Measure
The HRTL measure is still in pilot stages, which is an important caveat to remember when considering the estimates yielded from the measure. Item wording has not been finalized and more testing is necessary to ensure that the measure is a reliable and valid measure of school readiness for children ages 3 to 5. Critical next steps to the validation work will require the following steps from the measure’s developers:
- Cognitively test new items and pilot an updated measure. Many new items have been suggested by experts, including the measure’s Expert Panel, which is convened and overseen by HRSA MCHB. These new items need to be cognitively tested, meaning that they must be piloted with parents to assess whether parents consistently understand the meaning of a question’s wording. Cognitive testing will take place in 2020, which will include testing of items newly recommended for inclusion. After results of the cognitive testing are reviewed, pilot data will need to be collected (e.g., surveying a small group of parents) to understand whether the updated set of items comprise a meaningful measure of HRTL, as evaluated through statistical analysis.
- Establish concurrent validity. The HRTL measure is currently undergoing the first stages of validation, which include measurements of construct validity and invariance across ages and subgroups of children. More work is needed to establish concurrent and criterion validity (i.e., the measure’s ability to predict or correlate with other similar measures of child development). One way to investigate these two types of validity would be through a study in which parents of young children are administered multiple measures of child development and school readiness, including HRTL; analyses could indicate the level of similarity between the domains measured in the HRTL measure and other school readiness measures. Moderate to high correlations with other measures of school readiness and development would indicate that the measure is capturing the constructs of school readiness and health as intended.
- Establish predictive validity. Predictive validity refers to the degree to which a measure predicts outcomes that are hypothesized to be related. Since the HRTL measure is designed as a school readiness measure, it is expected to predict school performance in kindergarten and early elementary school. Predictive validity establishes that a measurement tool measures the outcomes that it intends to measure. Evidence of predictive validity is highly valued by policymakers and researchers and would further suggest the utility of a parent-report measure for preschoolers.
Conclusion
Data from HRTL pilot measures indicate that the measure is a promising tool that can contribute useful information regarding the well-being and school readiness of young children in the years leading up to their kindergarten entry. First, preliminary analyses with the pilot measure using 2017-2018 NSCH data indicate robust patterns of association between the HRTL pilot measure and correlates of kindergarten readiness, including exposure to early adversity, parental education, and family strengths (forthcoming in 2020). Second, estimates of the percentage of children who are On Track with the HRTL measure do not differ greatly from some kindergarten readiness or entrance assessments used by states. The commonalities are promising, given the differences between teacher-reported and parent-reported measures of development. Finally, as a population monitoring tool embedded within a very large, annual, and nationally representative survey that provides rich data on the context and conditions of child development and well-being within the United States, the HRTL measure is poised to serve as a key indicator of well-being.
Data from the HRTL measure can be tracked by local, state, and national policymakers and early childhood stakeholders to determine the needs of young children and their families, and to assess progress toward equity in school readiness outcomes in early childhood. Once finalized and validated, the HRTL measure can serve as a key indicator of school readiness that, along with other measures of well-being, can help researchers, policymakers, advocates, and families understand the health, well-being, and school readiness of young children in communities, states, and at the national level.
References
[1] Ghandour R. M., Hirai A. H., Moore K. A., Robinson L. R., Kaminski J. W., Lu M. C., & Kogan M. D. (under review) Healthy and Ready to Learn among U.S. preschool children: Prevalence and correlates of a pilot measure to assess school readiness. Pediatrics.
[2] Duncan, G. J., & Magnuson, K. (2011). The nature and impact of early achievement skills, attention skills, and behavior problems. In. G. Duncan and R. J. Murnane (Eds.), Whither Opportunity (47-70). Russell Sage Foundation: New York, NY.
[3] Ghandour, R. M., Moore, K. A., Murphy, K., Bethell, C., Jones, J. R., Harwood, R., … & Lu, M. (2019). School readiness among US children: Development of a pilot measure. Child Indicators Research, 12(4), 1389-1411.
[4] State Oversampling in the National Survey of Children’s Health: Feasibility, Cost, and Alternative Approaches. United States Census Bureau. Retrieved from: https://www.census.gov/content/dam/Census/programs-surveys/nsch/NSCH_State_Oversample_Summary_Document.pdf
[5] Offord Centre for Child Studies (2019). Early Development Instrument. Retrieved from: https://edi.offordcentre.com/
[6] Paul H. Brookes Publishing Co., Inc. (2019). Ages and Stages. Retrieved from https://agesandstages.com/
[7] Teaching Strategies (2020). Teaching Strategies GOLD. Retrieved from: https://teachingstrategies.com/solutions/assess/gold/
[8] Scheeringa MS, Haslett, N (2010). The reliability and criterion validity of the Diagnostic Infant and Preschool Assessment: A new diagnostic instrument for young children. Child Psychiatry & Human Development, 41(3), 299-312.
[9] CDI Advisory Board. (2015). The MacArthur-Bates Communicative Development Inventories (MB-CDIs). Retrieved from https://mb-cdi.stanford.edu/
[10]Reflection Sciences, Inc. (2019). MEFS App - Minnesota Executive Function Scale - Reflection Sciences. Retrieved from https://reflectionsciences.com/mefs-app/
[11] California Department of Education (2012). Desired Results Developmental Profile: Kindergarten. Retrieved from: https://drdpk.org/
[12] Harvard T. H. Chan School of Public Health. (2019). Caregiver Reported Early Childhood Development Instruments (CREDI). Retrieved from https://sites.sph.harvard.edu/credi/
[13] Cavallera, V., Dua, T., Black, M., Bromley, K., Cuartas, J., Eekhout, I., … & Weber, A. (2019). The Global Scale for Early Development (GSED). Early Childhood Matters, 80–84.
[14] Institute for Education Sciences, National Center for Education Statistics. Early Childhood Longitudinal Studies (ECLS) Program. Retrieved from: https://nces.ed.gov/ecls/
[15] Child Trends (2018). Healthy and Ready to Learn: A New National Outcome Measure of Kindergarten Readiness. Retrieved from: https://www.childtrends.org/project/kindergarten-readiness-national-outcome-measure
[16] Lynne Lane, K., Stanton-Chapman, T., Roorbach Jamison, K., & Phillips, A. (2007). Teacher and parent expectations of preschoolers’ behavior: Social skills necessary for success. Topics in Early Childhood Special Education, 27(2), 86–97.
[17] Snow, K. L. (2006). Measuring school readiness: Conceptual and practical considerations. Early Education and Development, 17(1), 7–41.
[18] Rescorla, L. A., Achenbach, T. M., Ivanova, M. Y., Bilenberg, N., Bjarnadottir, G., Denner, S., ... & Gonçalves, M. (2012). Behavioral/emotional problems of preschoolers: Caregiver/teacher reports from 15 societies. Journal of Emotional and Behavioral Disorders, 20(2), 68–81.
[19] Gagnon, S. G., Nagle, R. J., & Nickerson, A. B. (2007). Parent and teacher ratings of peer interactive play and social-emotional development of preschool children at risk. Journal of Early Intervention, 29(3), 228–242.