How are Students with Disabilities Performing in School?
Author
As this year marks the 25th anniversary of the Americans with Disabilities Act (July 26) and the 40th anniversary of the Individuals with Disabilities Education Act, IDEA, (formerly the Education for All Handicapped Children Act), it is time to reflect and report on the progress students with disabilities are making in school.
Many are testifying to the enormous progress that’s occurred (e.g., see a lovely piece by some of my favorite folks at AIR http://bit.ly/1MlUWyR), reminding us that only a few decades ago students with disabilities were regularly warehoused or even entirely excluded from school.
After we rightly celebrate the long-term progress in the education of students with disabilities, let’s pause to examine how we’ve done more recently.
The National Assessment of Educational Progress (NAEP), aka the Nation’s Report Card, has tracked the performance of students with disabilities since 1996 in reading and 1998 in math. Over those nearly 20 years, the average score in grade 4 for students with disabilities increased by eight points in reading (not significant, 176 to 184) and 15 in math (significant, 203 to 218). These changes, although smaller, are comparable to the increases for students without disabilities (10 and 20 points, respectively).
Looking at these data, one might conclude that students with disabilities have made recent gains in what they know and can do in school. That would likely be an incorrect conclusion.
The issue is that these NAEP data include too large a swath of students with disabilities; the scores include students who are covered under the IDEA with one of the 13 named disabilities (e.g., autism, deafness, speech impairments) as well as students covered under Section 504 of the Rehabilitation Act (any disability that interferes with a child’s ability to learn, including ones that may be addressed entirely through accommodations). The pool of students covered by the IDEA is more selective, and these students need more supports to get equal access to the curriculum, which is why they have individualized education plans or IEPs. [For a table of the differences between IEPs and Section 504 plans, click here.]
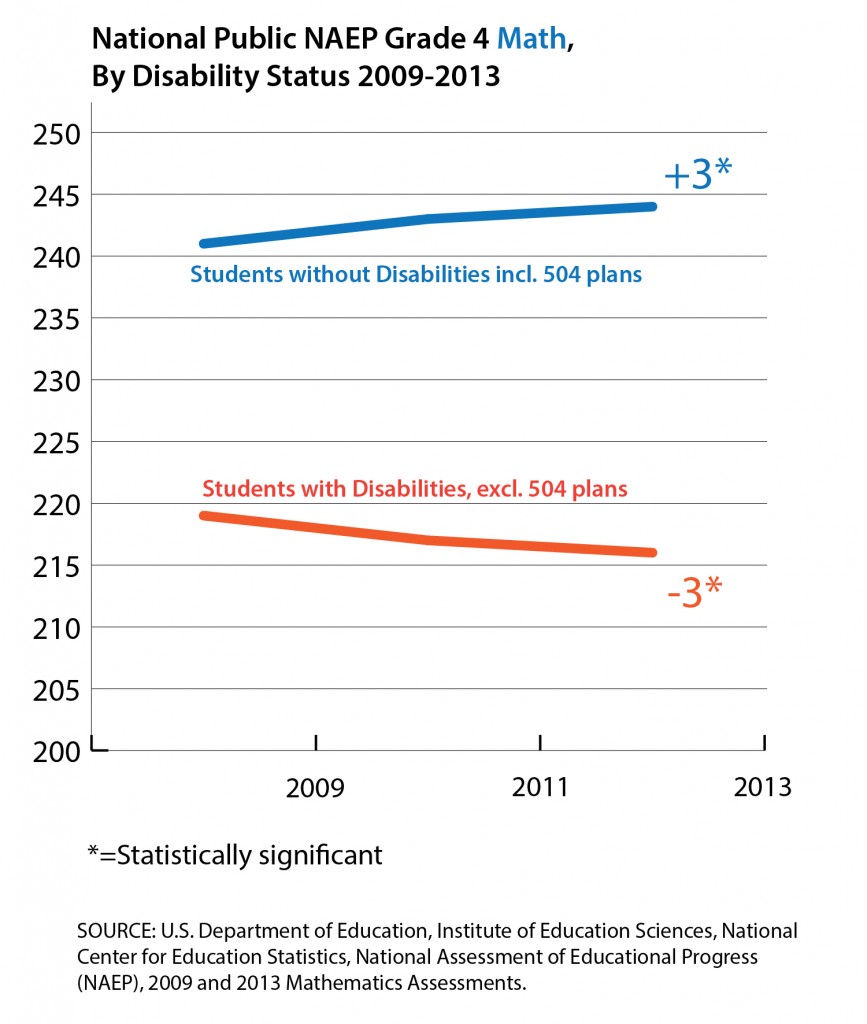
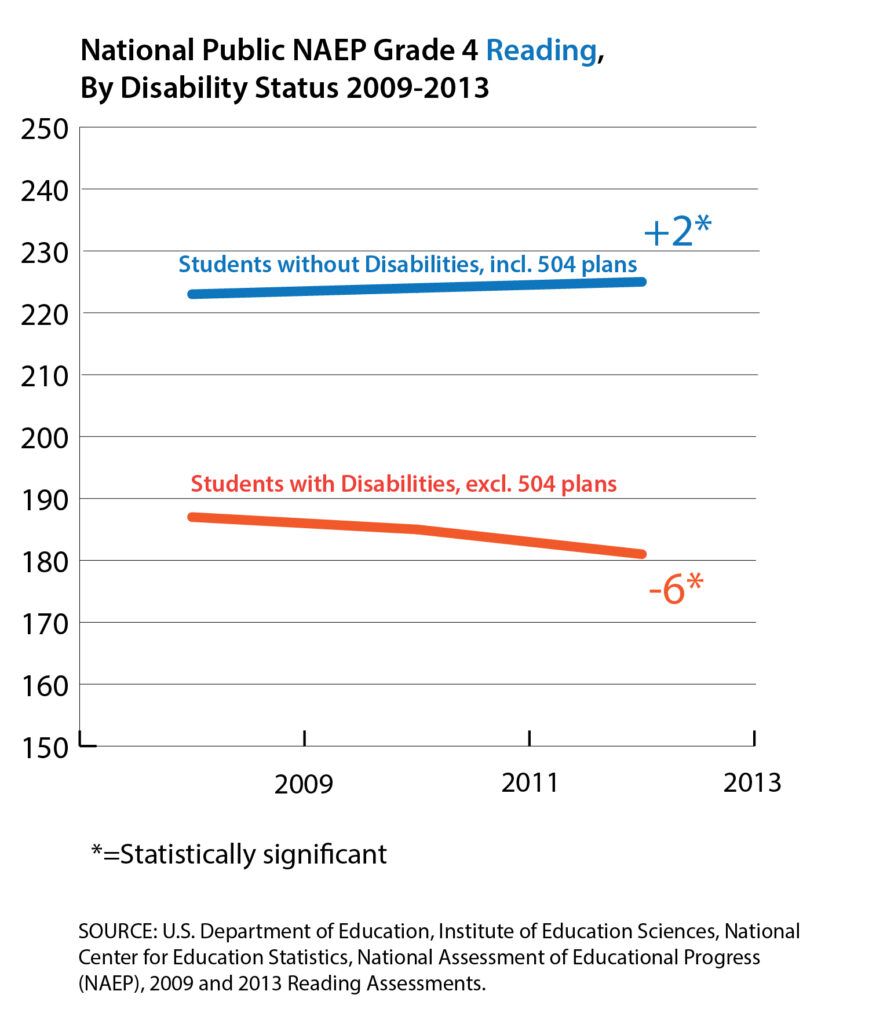
Looking only at students who have IEPs, we see a very different picture. NAEP started separating out these two pools of students with disabilities in 2009, and since that time, the national scores for students with disabilities excluding those with 504 plans are decreasing. In math, the average scores decreased by a statistically significant three points, and in reading, the scores declined by six points from 2009 to 2013 (see charts).
The decline may be due to many potential factors other than a worsening education system. For example, it might be that these numbers simply reflect an increasing percentage of test-takers with more severe disabilities.
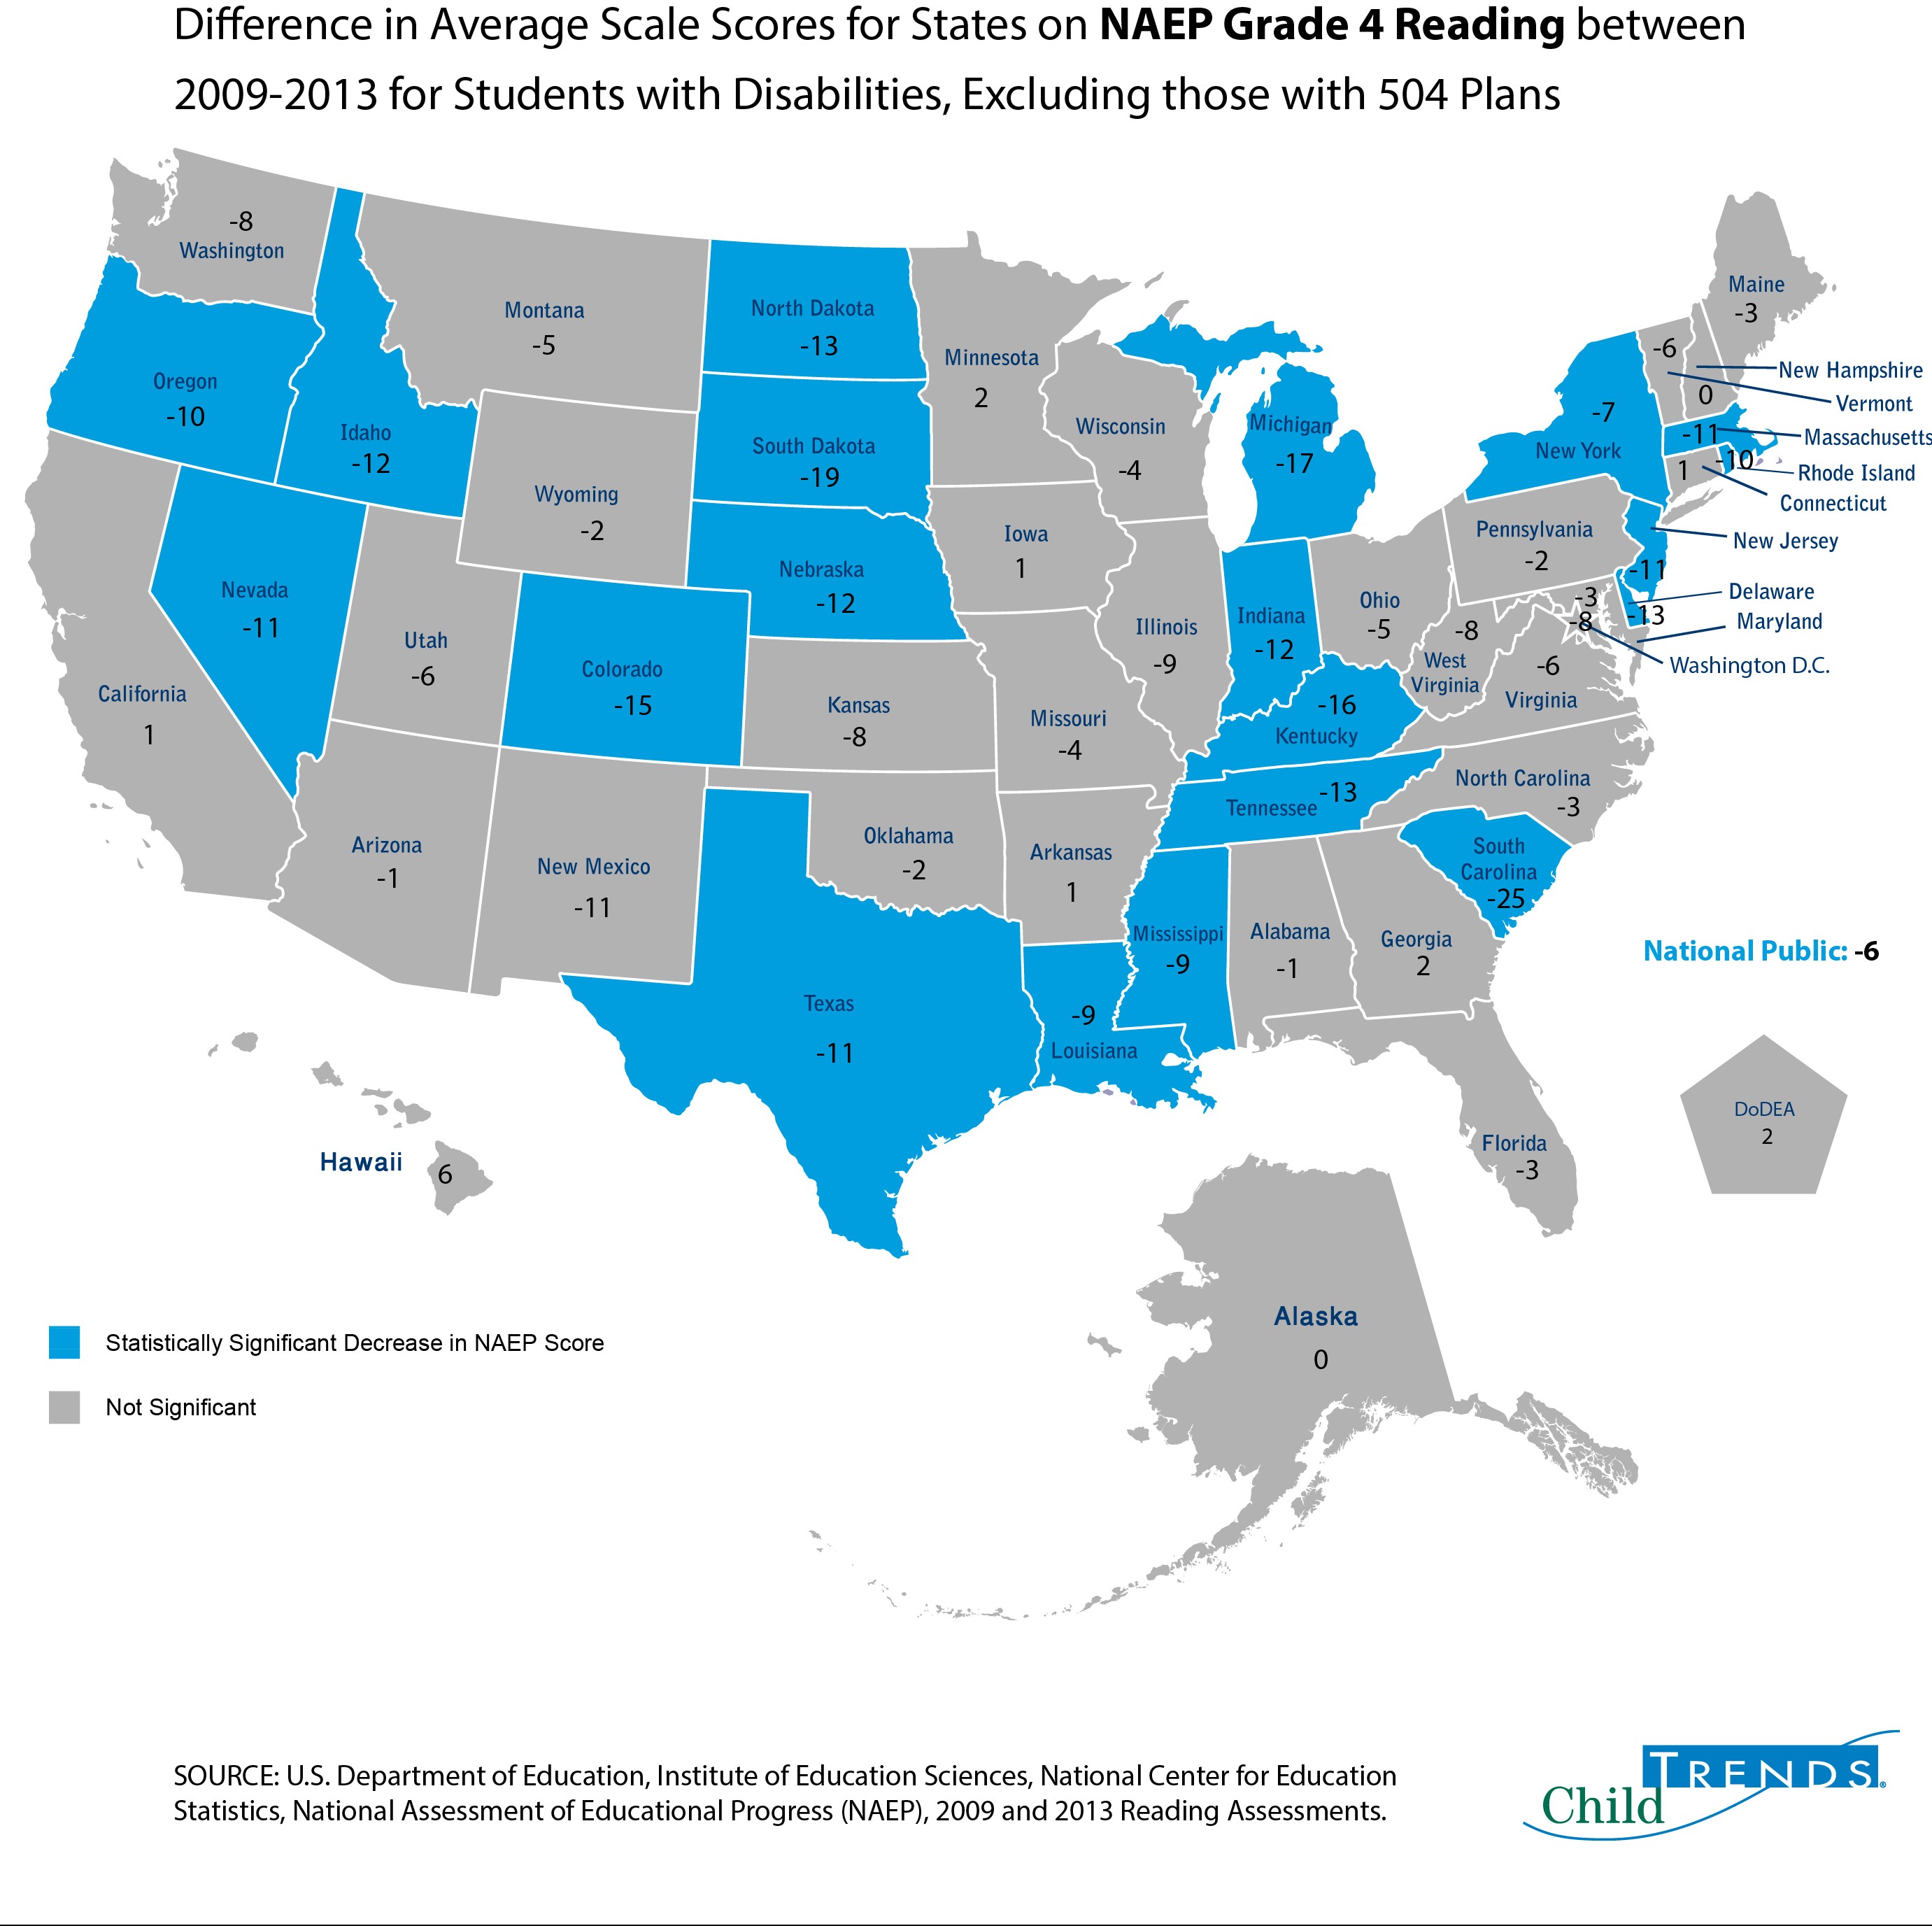
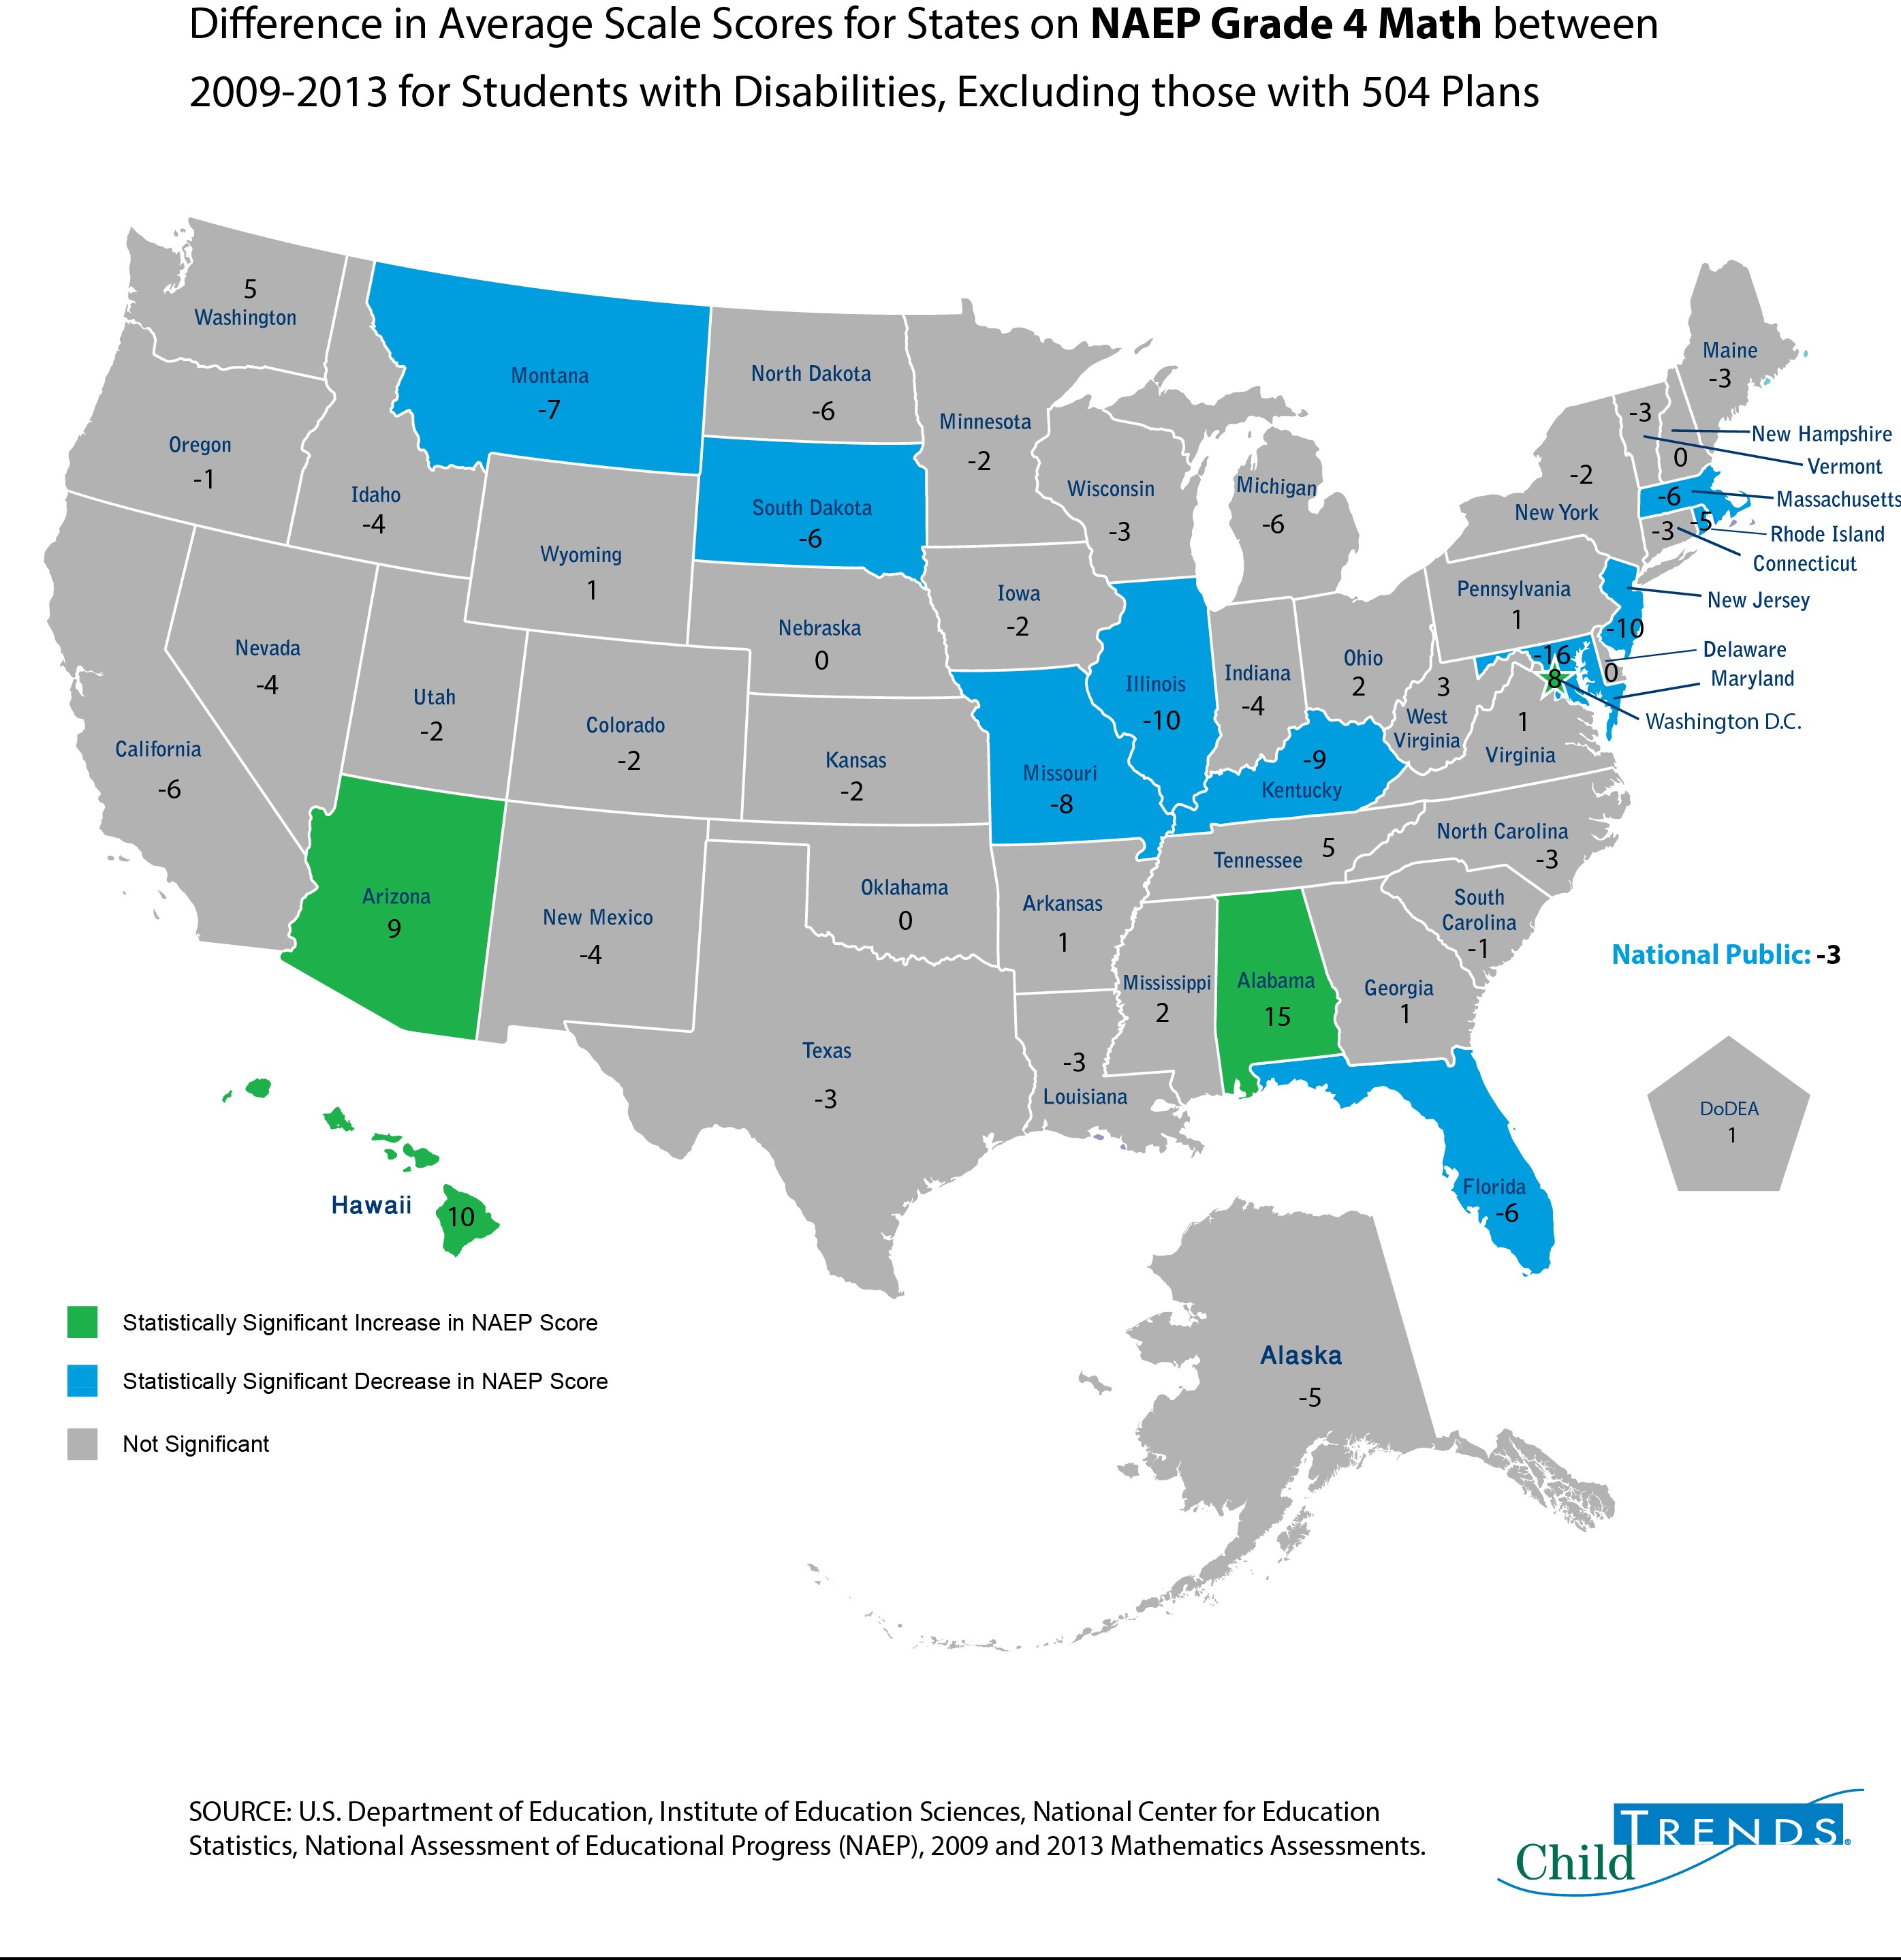
Interestingly, not all states are showing the same decline; states vary significantly in their recent trends. Some states have shown significant increases in average scores in math over those four years (e.g., Alabama and Arizona), and many have shown significant declines (e.g., Maryland and New Jersey).
Below we present the change in average state scores in grade 4 from 2009 to 2013 in reading and math. Although some previous studies have shown that for the most part, states’ inclusion policies do not change much year to year [1], these differences could certainly be due to changes in the rates of inclusion of students with disabilities in the assessments or in changes in the populations of students taking the tests, including factors that do not relate directly to their disability status.
In keeping with the purpose of the Acts we are celebrating, we want to see these averages increasing—and if they are not, then we need to ask why. We owe it to the thirteen percent [2] of our students who currently have IEPs to take a fresh look at the data, ask good questions, and, if merited, come up with some new ideas.
Natalia Pane, Senior Vice President of Research Operations
[1] See for example, Measuring the Status and Change of NAEP State Inclusion Rates for Students with Disabilities: Results 2007-2009, at https://nces.ed.gov/nationsreportcard/pdf/studies/Inclusion_Highlights_2009.pdf
[2] http://eddataexpress.ed.gov/data-element-explorer.cfm/tab/data/deid/5/
© Copyright 2024 ChildTrendsPrivacy Statement
Newsletter SignupLinkedInThreadsYouTube


