Gratitude
Definition
Appreciation of positive things in one’s life, through:
-
Recognition of positive things in one’s life
-
Experience of gratitude
-
Expression of thanks
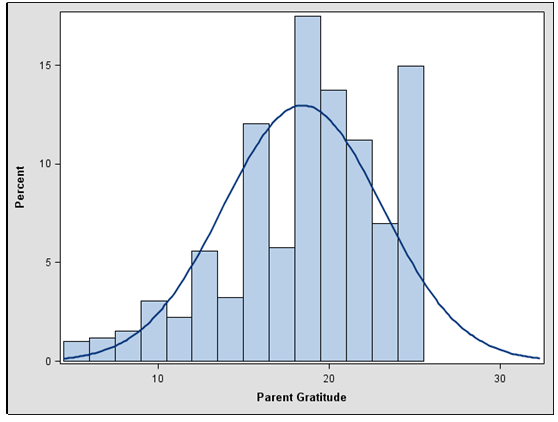
Parent Scale
Please indicate how much these statements describe you. (Not at all like my child, A little like my child, Somewhat like my child, A lot like my child, Exactly like my child)
-
My child feels thankful for the things he/she has.
-
My child thanks me for the things I do for him/her.
-
My child finds it easy to thank people.
-
My child expresses gratitude for his/her family.
-
My child shows appreciation for those who do nice things for him/her.
Parent Scale Psychometric Properties and Fit Indices
We conducted confirmatory factor analysis (CFA) to examine whether responses to the scale appeared to measure a single construct. Along with Cronbach’s alpha, we present model fit indices below.
-
Alpha=0.91 (excellent)
-
CFI=1.000 (excellent)
-
TLI=0.999 (excellent)
-
RMSEA=0.032 (excellent)
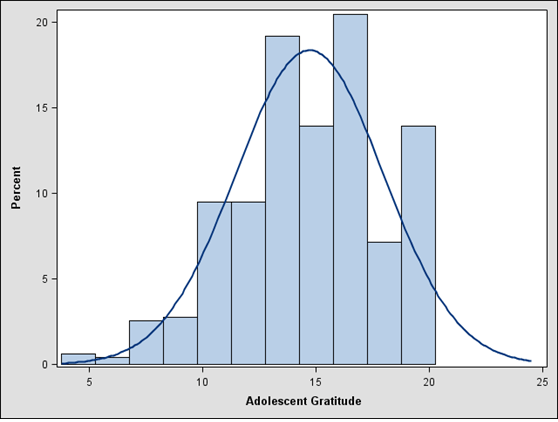
Adolescent Scale
Please indicate how much these statements describe you. (Not at all like me, A little like me, Somewhat like me, A lot like me, Exactly like me)
-
If I had to list everything I felt thankful for, it would be a very long list.
-
I feel thankful for everyday things.
-
When good things happen to me, I think about the people who helped me.
-
I find it easy to thank people.
Adolescent Scale Psychometric Properties and Fit Indices
-
Alpha=0.80 (excellent)
-
CFI=0.999 (excellent)
-
TLI=0.991 (excellent)
-
RMSEA=0.072 (adequate)
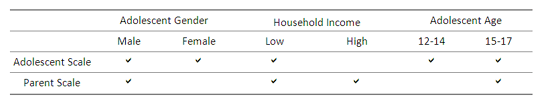
Subgroup Model Fit
We tested the final adolescent and parent models with subgroups to examine whether the model fit for different subsets of respondents in the same manner as the overall sample. Using the same fit statistic requirements as the overall models, a check mark indicates that the model fit for the subgroup. Household income is defined as “low” if it is less than the median income in the sample. “High” household income indicates that the household income was equal to or greater than the sample’s median.
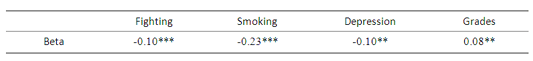
Concurrent Validity
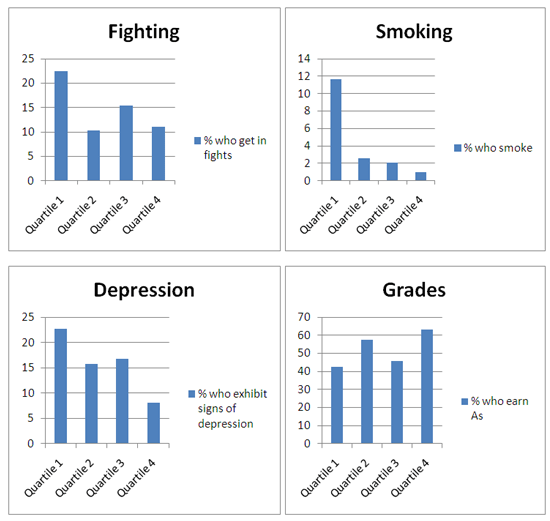
Four single item measures were used to examine the concurrent validity of the adolescent scale: a measure of social behavior (fighting), a measure of health behavior (smoking), a measure of emotional health (adolescent-reported depressive symptoms), and a measure of cognitive development (grades).
Concurrent validity was examined in two ways: with bivariate and multivariate analyses. The table below presents the results of multivariate analyses, which control for: teen gender, teen age, teen race, household income, household size, parental education, parental marital status, parental home ownership, parental employment, and metropolitan area and region of residence. The beta coefficient of the relationship between the construct’s scale and outcome is presented.
The graphs below show the bivariate relationships between the adolescent scale and outcomes. Results are presented for relationships that were at least moderately significant (at the 0.10 level) in the multivariate analyses. Note that the y axis scales are different in each graph.
© Copyright 2024 ChildTrendsPrivacy Statement
Newsletter SignupLinkedInThreadsYouTube