Social Competence
Definition
A set of positive skills necessary to get along well with others and function constructively in groups, including:
-
Respecting and expressing appreciation for others
-
Being able to work well with others, present ideas and listen to others’ ideas, and work and cooperate in heterogeneous groups
-
Demonstrating context appropriate behavior and ability to behave according to social norms
-
Using a range of skills or processes aimed at resolving conflict
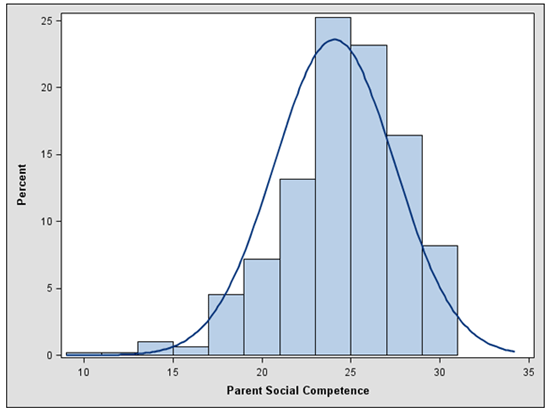
Parent Scale
Please indicate how much these statements describe your child. (Not at all like my child, A little like my child, Somewhat like my child, A lot like my child, Exactly like my child)
-
My child avoids making other kids look bad.
-
If two of my child’s friends are fighting, my child finds a way to work things out.
-
When my child works in groups, he/she does his/her fair share.
How often… (None of the time, A little of the time, Some of the time, Most of the time, All of the time)
-
does your child get along well with people of different races, cultures, and religions?
-
does your child follow the rules at a park, theater, or sports event?
-
does your child respect other people’s point of view, even if he/she disagrees?
Parent Scale Psychometric Properties and Fit Indices
We conducted confirmatory factor analysis (CFA) to examine whether responses to the scale appeared to measure a single construct. Along with Cronbach’s alpha, we present model fit indices below.
-
Alpha=0.62 (adequate)
-
CFI=0.983 (excellent)
-
TLI=0.971 (excellent)
-
RMSEA=0.040 (excellent)
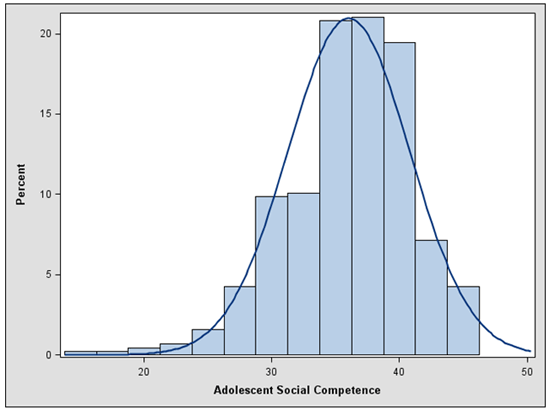
Adolescent Scale
Please indicate how much these statements describe you. (Not at all like me, A little like me, Somewhat like me, A lot like me, Exactly like me)
-
I avoid making other kids look bad.
-
If two of my friends are fighting, I find a way to work things out.
-
When I work in school groups, I do my fair share.
Please indicate how often this happens. How often…(None of the time, A little of the time, Some of the time, Most of the time, All of the time)
-
do you get along well with people of different races, cultures, and religions?
-
do you listen to other students ideas?
-
do you control your anger when you have a disagreement with a friend?
-
can you discuss a problem with a friend without making things worse?
-
do you follow the rules when you are at a park, theater, or sports event?
-
do you respect other points of view, even if you disagree?
Adolescent Scale Psychometric Properties and Fit Indices
-
Alpha=0.79 (good)
-
CFI=0.986 (excellent)
-
TLI=0.981 (excellent)
-
RMSEA=0.042 (excellent)
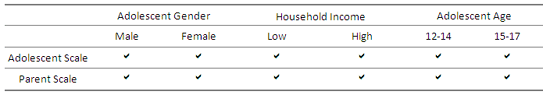
Subgroup Model Fit
We tested the final adolescent and parent models with subgroups to examine whether the model fit for different subsets of respondents in the same manner as the overall sample. Using the same fit statistic requirements as the overall models, a check mark indicates that the model fit for the subgroup. Household income is defined as “low” if it is less than the median income in the sample. “High” household income indicates that the household income was equal to or greater than the sample’s median.
Concurrent Validity
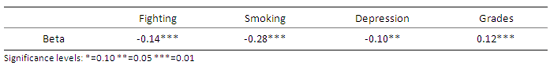
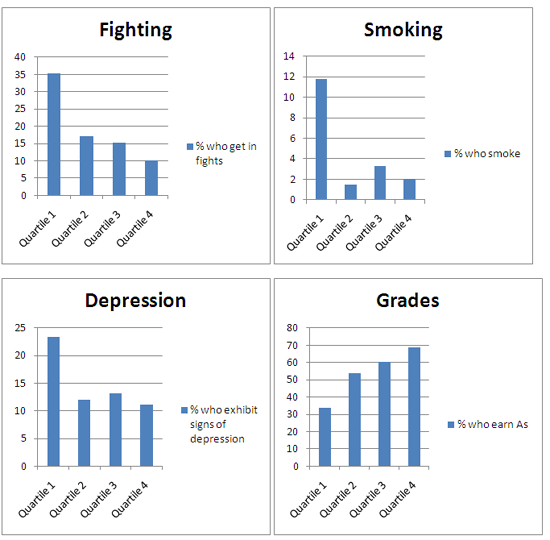
Four single item measures were used to examine the concurrent validity of the adolescent scale: a measure of social behavior (fighting), a measure of health behavior (smoking), a measure of emotional health (adolescent-reported depressive symptoms), and a measure of cognitive development (grades).
Concurrent validity was examined in two ways: with bivariate and multivariate analyses. The table below presents the results of multivariate analyses, which control for: teen gender, teen age, teen race, household income, household size, parental education, parental marital status, parental home ownership, parental employment, and metropolitan area and region of residence. The beta coefficient of the relationship between the construct’s scale and outcome is presented.
The graphs below show the bivariate relationships between the adolescent scale and outcomes. Results are presented for relationships that were at least moderately significant (at the 0.10 level) in the multivariate analyses. Note that the y axis scales are different in each graph.
© Copyright 2024 ChildTrendsPrivacy Statement
Newsletter SignupLinkedInThreadsYouTube