
Latest from Child Trends

Apr 23 2024
Apr 15 2024


Data Spotlight
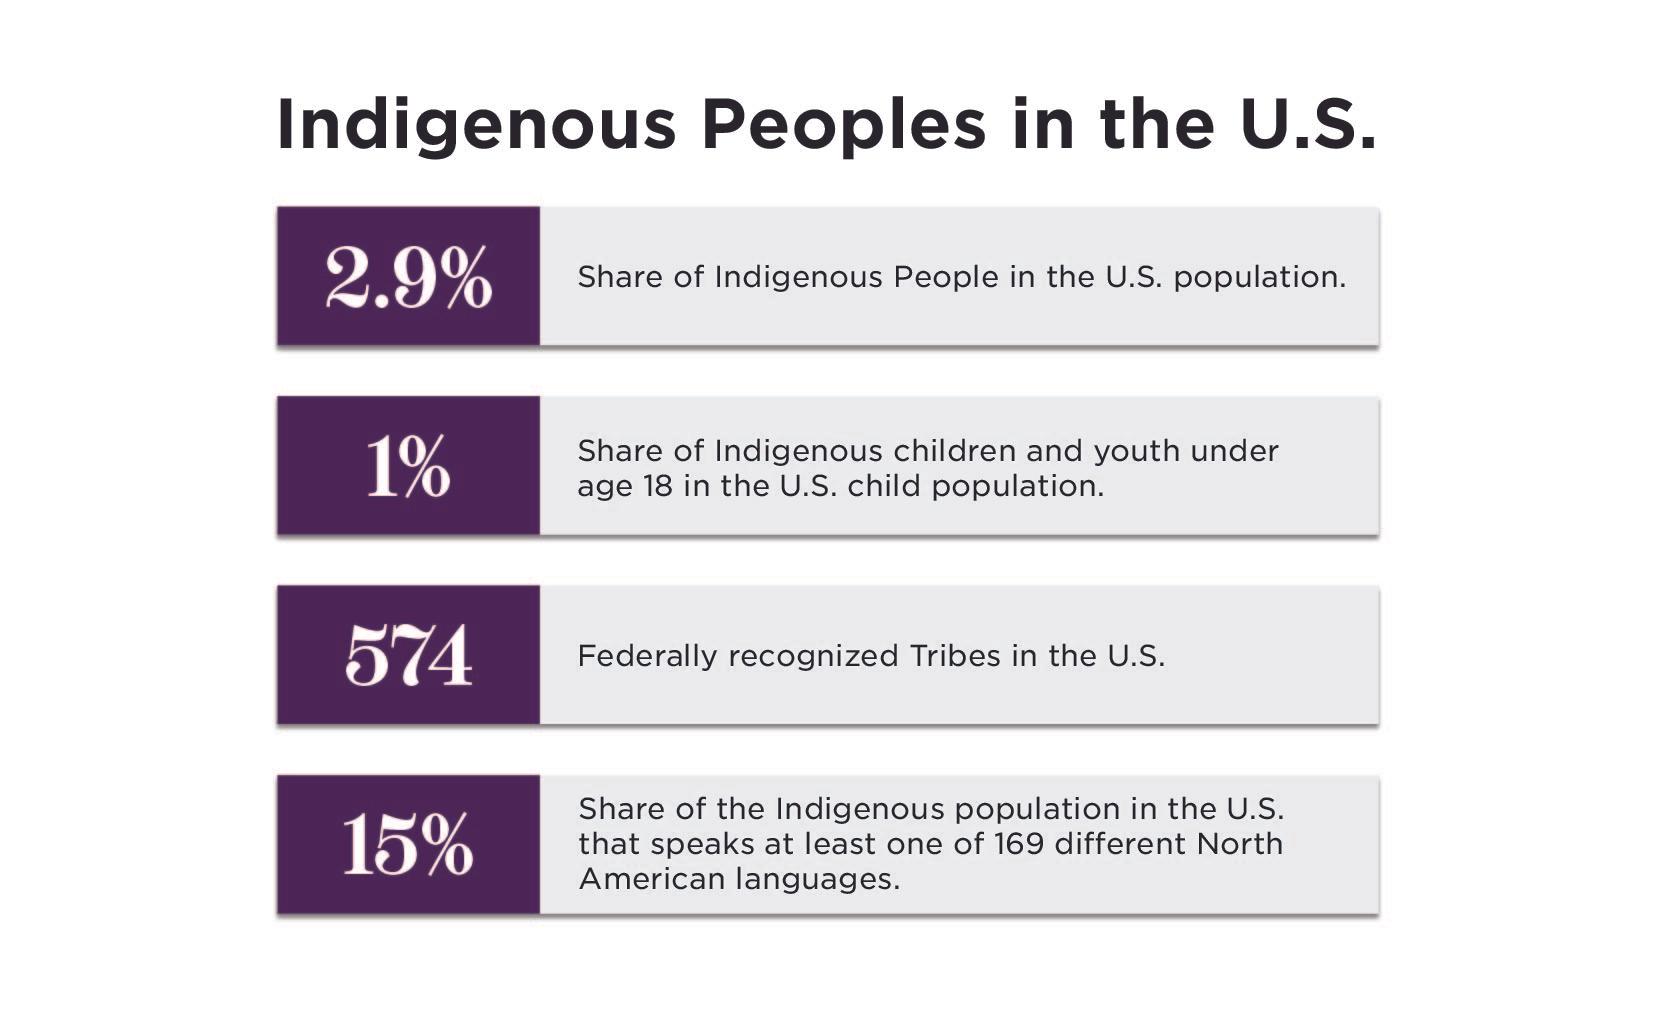
November is Native American Heritage Month! There are over 11 million people who are Indigenous to the United States, all of whom carry Indigenous Knowledge with them that has been passed down intergenerationally from Elders to children and youth.
Read More
Research on Child Trends’ Partner Sites
Mar 28 2024
Mar 13 2024
Feb 8 2023
ChildTrends12300 Twinbrook Parkway Suite 235 Rockville MD 20852240.223.9200
© Copyright 2024 ChildTrendsPrivacy Statement
Newsletter SignupLinkedInThreadsYouTube