
Lessons From a Historic Decline in Child Poverty
Chapter 2. The Influence of Economic and Demographic Trends on Changes in Child Poverty
Economic and demographic trends can play a substantial role in the changing landscape of child poverty. A strong economy—indicated by macroeconomic growth, high rates of labor force participation, wage growth, and low unemployment—has historically been associated with higher household incomes and lower rates of child poverty.
Demographic shifts can also influence the incidence of child poverty because of their strong correlation with household income and access to employment, other opportunities for economic mobility, and anti-poverty programs. Existing research identifies five demographic shifts that are most likely to influence child poverty: changes in educational attainment, changes in family structure, trends in the age of childbearing, and shifts in the racial and ethnic composition and the immigrant share of the population—as well as the intersection of these forces.
Economic and demographic trends also interact with social policy to influence child poverty rates.[1] For example, some social policies adapt during times of economic downturns to buffer families from poverty. Additionally, policies or barriers that limit immigrant families’ access to the labor market or the social safety net could inhibit the country’s ability to reduce child poverty, particularly given that children in immigrant families make up a growing share of the U.S. population.
What’s in this chapter: In this chapter, we examine the link between economic and demographic shifts from 1993 to 2019 and the period’s declining child poverty rate. First, in Section 1, we provide an overview of the economic and demographic shifts that occurred during this time. In Section 2, we describe our methodological approach. In Section 3, we examine the unique influence of economic and labor market factors on child poverty and deep poverty (family resources < 50% of the poverty threshold). In Section 4, we examine the unique influence of demographic factors on child poverty and deep poverty. In Section 5, we briefly look at how the influence of economic and demographic factors on poverty rates among different populations of children may vary. We close this chapter with a discussion of our key findings in Section 6.
No time to read Chapter 2? Read this instead.
Research parameters to keep in mind
Overall: We examine the roles of economic, labor market, and demographic factors on child poverty rates.
More specifically:
-
- The economic factors we examine include unemployment rates, real gross domestic product per capita, median wages, minimum wages, and single mothers’ labor force participation.
- The demographic factors we examine include the share of children living with two parents, the share of adults with a high school degree or higher, teen birth rates, the racial/ethnic distribution of the child population, and the share of children in immigrant families.
Time frame examined: From 1993 to 2019.
Poverty levels examined:
-
- Poverty (<100% of the Supplemental Poverty Measure threshold)
- In 2019, income less than approximately $28,881 for a two-adult, two-child household that rents
- Deep poverty (<50% of the Supplemental Poverty Measure threshold)
- In 2019, income less than approximately $14,440 for a two-adult, two-child household that rents
- Poverty (<100% of the Supplemental Poverty Measure threshold)
Key findings
Economic and labor market factors, together, explained about 33 percent of the decline in child poverty and 41 percent of the decline in deep poverty from 1993 to 2019; all of these economic- and labor-related declines can be explained by an overall decline in unemployment, increases in single mothers’ labor force participation, and higher state minimum wages. Gross domestic product (GDP) per capita and median wages both grew from 1993 to 2019, yet neither of these were associated with the decline in child poverty or deep poverty.
-
- Unemployment rates were considerably lower in 2019 than in 1993, which could explain as much as 18 percent of the total decline in child poverty and 22 percent of the decline in deep poverty from 1993 to 2019.
- Increases in single mothers’ labor force participation were associated with decreases in child poverty and deep poverty and may explain about 9 percent of the decline in child poverty and 10 percent of the decline in deep poverty from 1993 to 2019.
- Higher state minimum wages were also associated with lower rates of child poverty and may explain about 7 percent of the decline in child poverty and 9 percent of the decline in deep poverty from 1993 to 2019.
Demographic factors (which include those that contributed to the decline, as well as countervailing factors) did not contribute to the decline in child poverty from 1993 to 2019, but were associated with about 43 percent of the decline in deep poverty.
-
- The share of children who are Hispanic or who live in immigrant families grew from 1993 to 2019. These demographic shifts were associated with increases in child poverty rates; this likely reflects the high incidence of Hispanic and immigrant parents who face discrimination in the labor market and restricted access to the social safety net, both of which limit efforts to reduce child poverty. Increases in the share of children living in immigrant families were also associated with increases in rates of deep poverty among children.
- The share of Black children—whose parents often face hiring discrimination and wage inequality in the workforce—decreased from 1993 to 2019 and was associated with decreases in child poverty, although this shift’s contribution to the overall decline was small.
- The large decrease in the number of teen births per 1,000 females ages 15 to 19 from 1993 to 2019 was not associated with decreases in child poverty, but was associated with decreases in deep poverty. The decline in teen births was associated with 52 percent of the decline in deep poverty. However, the association between teen birth rates and child deep poverty is reciprocal—that is, teen birth rates are a symptom of child deep poverty as well as a potential contributor to it, so causality is difficult to determine.
- Increases in the share of children living in two-parent families were associated with decreases in child poverty and deep poverty; however, from 1993 to 2019, the share of children living in two-parent families increased only minimally and so did not contribute much to the decline in child poverty or deep poverty during this time.
Combined, economic, labor market, and demographic factors explained about 22 percent of the decline in child poverty from 1993 to 2019. However, this combination of economic, labor market, and demographic factors explained considerably more—84 percent—of the decline in child deep poverty from 1993 to 2019.
Section 1: Overview of the economic and demographic shifts
As context for our analyses in this chapter, we begin with information regarding economic and demographic trends of the past quarter-century.
How has the economy and labor market changed from 1993 to 2019?
In Figure 2.1 below, we show how economic and labor market factors have changed over time, with an eye toward whether shifts in economic and labor market trends are—or are not—in sync with trends in the child poverty rate. While we focus on 1993 to 2019, we include trends back to 1980 for context and comparison. All estimates have been adjusted for inflation using the Consumer Price Index.
Figure 2.1. Changes in Economic and Labor Market Indicators, 1980-2019
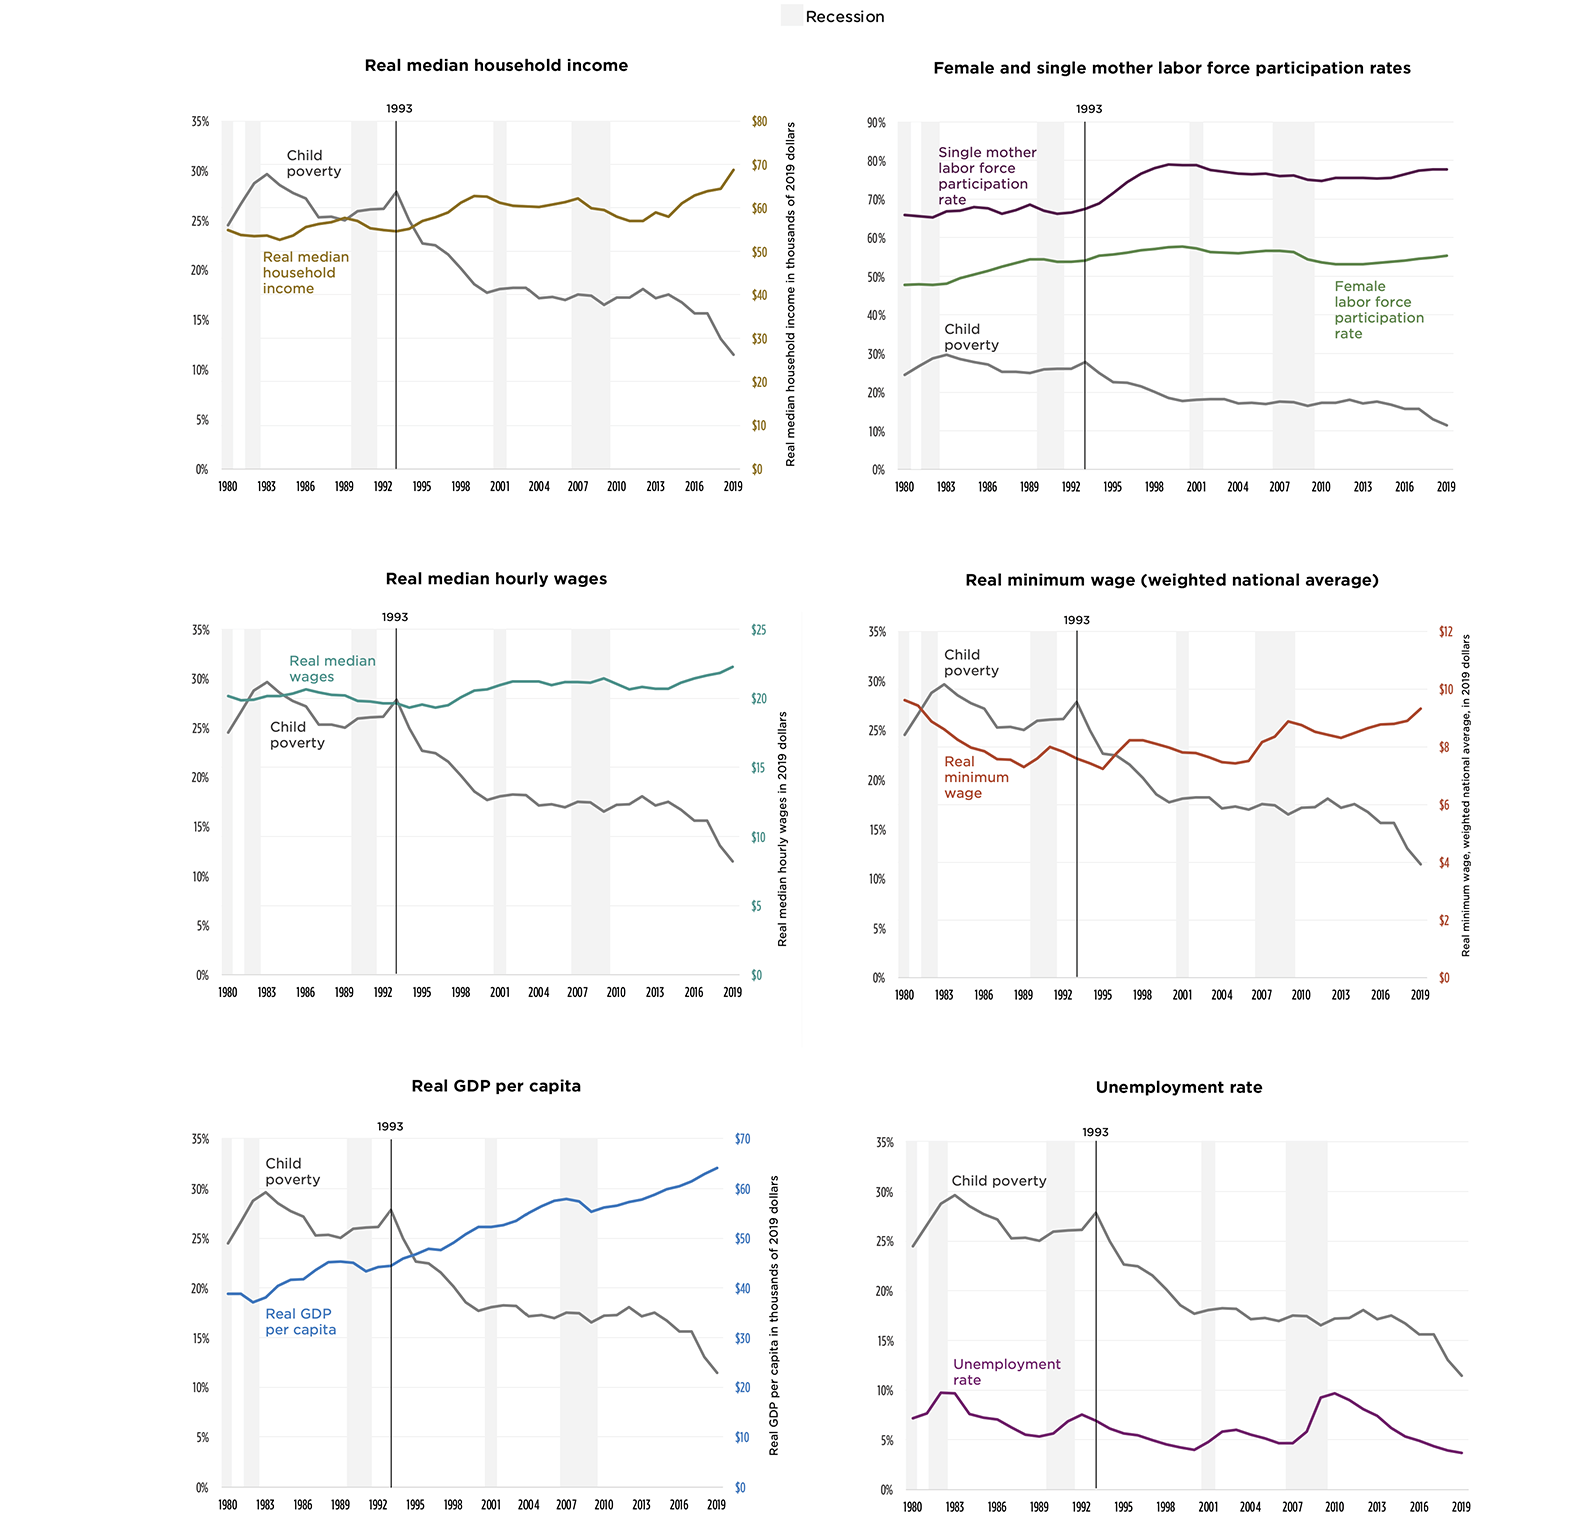
Note: Some of the above graphs have two scales: one on the left axis, which indicates rates or percentages, and one on the right axis, which indicates thousands of 2019 dollars.
Sources: Child Trends’ analysis of the CPS ASEC, the historical Supplemental Poverty Measure data from the Columbia Center on Poverty and Social Policy, anchored to 2012 thresholds, the Merged Outgoing Rotation Group files of the CPS, the Bureau of Labor Statistics, the U.S. Department of Labor, and the Federal Reserve Bank of St. Louis. Recession data are from the National Bureau of Economic Research.
Real (inflation-adjusted) GDP per capita grew by approximately two-fifths (44%) in the last 26 years, from $44,480 in 1993 to $64,100 in 2019.[2] However, this strong and fairly steady economic growth did not fully translate to similar increases in median household incomes. Real median household income rose and fell throughout this period, partly in response to expansions and contractions in the economy. Across the 26 years of our analysis time frame, real median household income increased by about 26 percent, from $54,600 in 1993 to $68,730 in 2019, with much of this growth occurring in the mid- to late-1990s and following the Great Recession. Growth in median household income was weaker than growth in GDP likely, in part, due to rising income inequality. Over time, households already earning higher incomes have accrued disproportionate shares of economic growth. Indeed, income inequality—often measured by the ratio of household income at the 90th percentile to that at the 10th percentile—grew about 18 percent from 1993 to 2019 (not shown in figure).
With increasing income inequality in mind, we also look at minimum wage to see how wages at the bottom of the wage distribution have changed over this time. While the real value of the federal minimum wage declined from 1993 to 2019, the average minimum wage increased by 23 percent after accounting for state-level increases in the minimum wage[3]—from $7.59 in 1993 to $9.32 in 2019, with much of this increase occurring after 2006. It is important to note, however, that not all low-wage workers benefitted from these minimum wage increases; those likely to be excluded include workers residing in states that did not experience increases in the real minimum wage and workers not covered by minimum wage laws (e.g., independent contractors and gig workers, farm workers employed on small farms, and unauthorized immigrants).
For most families, changes in household income stem from changes in wages, but also from changes in labor force participation, hours worked, and the number of earners in the household. Overall labor force participation (not shown in Figure 2.1) remained stable (at 66-67%) from 1993 to 2009, and then decreased 5 percent during the following decade to 63 percent in 2019. Female labor force participation also remained fairly stable, with a small net increase of 2 percent: from 54 percent in 1993 to 55 percent in 2019.
There was, however, a notable increase in single mothers’ labor force participation in the mid- to late-1990s, which is particularly pertinent for child poverty given the high rates of poverty among children in families headed by single mothers. Single mother labor force participation increased by 17 percent, from 67 percent in 1993 to 79 percent in 1999. These increases occurred alongside a substantial expansion of the Earned Income Tax Credit (EITC), a robust economy, and welfare reform (which introduced work requirements and time limits).[4] Following these increases during the 1990s, single mother labor force participation declined slightly from 2000 through the Great Recession, before beginning to inch up again—for a net increase of 15 percent from 1993 to 2019.
Unemployment rates, not surprisingly, rise during recessions and fall during economic booms. Prior to 1993, the child Supplemental Poverty Measure (SPM) poverty rate closely mirrored rises and falls in unemployment. That is, during recessions (indicated in figures by vertical light gray lines), the unemployment rate increased, as did the SPM child poverty rate. This was also true of the pre-tax-and-transfer (PTT) child poverty rate, which is based on market income and does not account for government tax and transfer programs.[5] After 1993, the child SPM poverty rate followed a different pattern: Unlike the child PTT poverty rate, which continues to rise and fall with economic cycles, the SPM child poverty rate fell sharply during economic booms and mostly stabilized during recessions and recovery periods.
Demographic factors that may influence the child poverty landscape
We now turn to an examination of shifts in key demographic factors that may influence child poverty. (See Figure 2.2 below.) Again, we are interested in how these demographic factors changed from 1993 to 2019, but we extend the time series back to 1980 for context and comparison.
In the quarter century from 1993 to 2019, the number of teen births per 1,000 females ages 15 to 19 (hereafter referred to as the teen birth rate) dropped dramatically (by 72%), from 59 births per 1,000 females ages 15 to 19 in 1993, to 17 in 2019—a record low. Teens who have children while in high school face unique challenges to completing their education and in balancing their school, work, and child care needs, as well as limited employment opportunities and difficulties finding social support. As a result, children born to young parents are more likely to live in poverty. However, the relationship between teen birth rates and child poverty is nuanced: Higher teen birth rates are more likely in families with few economic resources and often lead to more limited future economic opportunities, so causality is difficult to determine.
During this same time period, the American population has, on average, attained higher levels of education, and the share of adults (ages 25 or older) who completed four years of high school or more increased 12 percent, from 81 percent in 1993 to 91 percent in 2019. In general, higher levels of educational attainment have been consistently and strongly associated with higher earnings, and this association has grown even stronger over time.
The share of children living in two-parent families (which includes both married and cohabiting parents) was mostly stable from 1993 to 2019, although overall there was a slight increase (4%). Shifts in the share of children living in two-parent families have the potential to influence child poverty rates, in large part because the earnings potential of dual-parent households is greater than that of single-parent households. A second parent can also help to balance and share in child care and household tasks, which allows greater flexibility and sustainability of employment. In addition to lacking a second earner and/or caregiver, single parents face multiple challenges to labor force participation, such as the need to find affordable child care and the lack of family-friendly work policies.
Why have we included married parents and cohabiting parents together?
Throughout this analysis, we look at the number of parents residing in the household, rather than parental marital status, to focus on the resources available to a child—both in terms of earnings potential, as well as having a present parent.
The racial and ethnic composition[6] of the child population also shifted during this time to include greater proportions of Hispanic children and Asian/Hawaiian/Pacific Islander children. The share of Hispanic children grew by 87 percent, from 14 percent in 1993 to 26 percent, while the share of Asian/Hawaiian/Pacific Islander children grew from 3 percent in 1993 to 5 percent in 2019.[7] Meanwhile, the share of Black and White children decreased (by 13% and 25%, respectively).[8] There are well-documented and persistent disparities in child poverty rates by race and ethnicity. The roots of these disparities lie in systemic discrimination that limits job opportunities and leads to unequal pay, fewer benefits, lower job quality, and disparate outcomes within employment (e.g., job channeling, promotions, etc.) for Hispanic and Black workers in particular.
The percent of children living in immigrant families also grew, from 17 percent in 1993 to 28 percent in 2019, an increase of 64 percent; Hispanic and Asian/Hawaiian/Pacific Islander children comprise the two largest groups of children in immigrant families. In addition, despite high levels of employment, immigrant families—which include many Hispanic and Asian/Hawaiian/Pacific Islander families—may face unique barriers to higher-wage jobs and income supports that promote economic mobility due to language barriers, lower levels of education that reflect the development of their country of origin, lower returns to education obtained in other countries, limited U.S. networks, and policies that restrict their access to social safety net programs. Without broad reforms to systemic discrimination and structural barriers that can trap immigrants in poverty, growing populations of immigrants can contribute to higher poverty rates.
Demographics are not destiny, though. Shifts in the population’s demographics need not be tied to shifts in child poverty. However, each population-level demographic factor discussed above reflects a unique constellation of barriers and opportunities to access economic opportunities, such as higher wages, stable employment, and a stronger social safety net. For this reason, we view each of these demographic variables as proxies for social, structural, and environmental factors that link rates of children in single-parent, Black, Hispanic, Asian/Hawaiian/Pacific Islander, and immigrant families to poverty. Stated differently, demographic shifts in the population reflect changes in the percentage of the population exposed to systemic barriers to economic mobility and exclusionary policies that restrict immigrant families’ access to the safety net. We seek to understand how changes in the prevalence rates of the population exposed to such barriers impacts the child poverty rate.
Figure 2.2. Changes in Demographic Conditions, 1980-2019
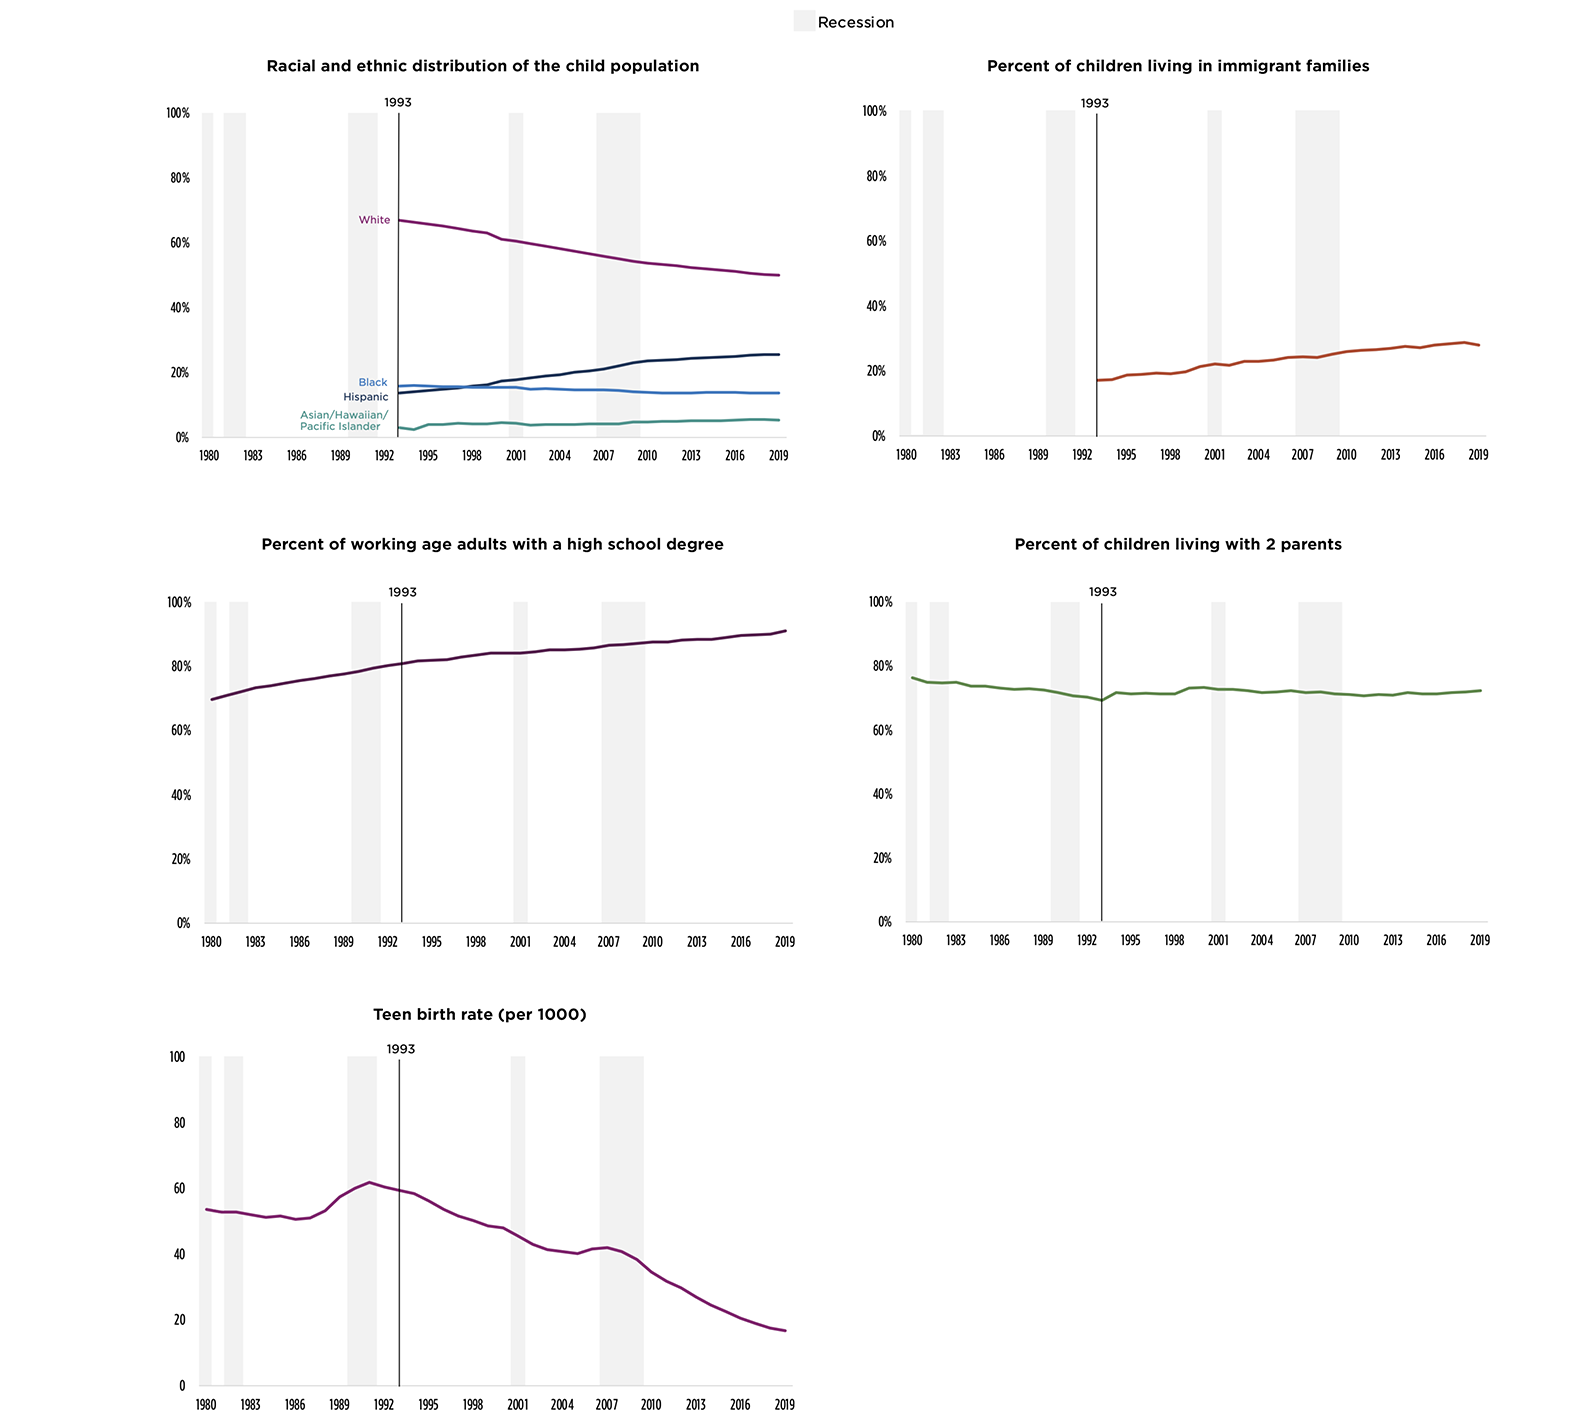
Sources: Child Trends’ analysis of the CPS ASEC, the historical Supplemental Poverty Measure data from the Columbia Center on Poverty and Social Policy, anchored to 2012 thresholds, and data from National Vital Statistics Reports, Volume 63, Number 4, (08/20/2014) (cdc.gov). Recession data are from the National Bureau of Economic Research.
In sum, from 1993 to 2019, the economy grew, with rising GDP per capita, rising median household income, higher state-level minimum wages, higher rates of single mother labor force participation, and lower unemployment rates in 2019 than in 1993. These trends could have each contributed to reductions in child poverty.
Additionally, demographic changes—including a substantial decline in teen birth rates and an increase in the share of the adult population with a high school degree—could have also contributed to reductions in child poverty. The share of children living with two parents is likely broadly associated with rates of child poverty, but this factor increased very little from 1993 to 2019. Meanwhile, as our country becomes more diverse, the systematic barriers disproportionately experienced by persons of color and immigrants to accessing employment, equitable pay, other economic mobility opportunities, and social safety net programs likely served as a countervailing force.
In the remainder of this chapter, we examine the extent to which these changes in economic and demographic factors are associated with changes in child poverty and contribute to the decline in child poverty from 1993 to 2019.
Section 2: Our approach
Building on prior work by economists Hillary Hoynes, Marianne Page, and Ann Huff Stevens, we estimate the extent to which changes in child poverty rates were explained by changes in five economic measures (unemployment rates, real GDP per capita, real median wages, single mothers’ labor force participation, and real state minimum wages)[9] and five demographic factors (the proportion of adults with a high school degree or more, the share of children living in two-parent families, the teen birth rate, the racial and ethnic distribution of the child population, and the share of children living in immigrant families).
We have two goals in examining the influence of economic and demographic factors on child poverty. One goal is to understand whether economic or demographic shifts helped explain the decline in child poverty from 1993 to 2019. A second goal is to understand the degree to which each of these economic and demographic factors play a role in child poverty more broadly. Answering the first question tells us what factors have led to the historic decline, which in turn depends on what factors actually changed over that time period; the second answer may highlight factors that did not change much from 1993 to 2019 (and so did not explain the decline) but are, nonetheless, powerful predictors of child poverty that can inform poverty reduction efforts moving forward.
Statistically, we need to tackle these goals in reverse order. So, in the sections that follow, we first quantify the associations between changes in child poverty and changes in each of our economic and demographic factors. That is, we present estimates of how much, on average, child poverty rates during this time were likely to increase or decrease, given a one unit change in each economic or demographic factor and holding everything else constant. This tells us how much predictive power each factor has—that is, if there are increases in a given factor (let’s say, the share of children living in two-parent families), how much of an associated decrease in child poverty would we expect to see. This speaks to the second goal noted above and allows us to identify potential policy levers, or factors that policymakers could consider as potential avenues for moving the dial on child poverty.
Next, we use the estimates generated in the first step to predict how much each factor contributed to the decline in child poverty that occurred from 1993 to 2019. This latter prediction accounts for both 1) the relationship between the given factor and child poverty and 2) the actual amount by which the given factor changed from 1993 to 2019. For example, increases in a factor such as the share of children who live in two-parent families may be found to be moderately related to decreases in child poverty, meaning that increases in this factor have moderate predictive power. However, if there is very little population-level change in the share of children in two-parent families from 1993 to 2019, then it is not going to explain much, if any, of the decline in child poverty that happened during this time. Other factors—for example, teen birth rates—may have more modest predictive power but declined so dramatically over this time period that they explain quite a bit of the 1993 to 2019 decline. That is, such factors have more explanatory power for declines during the time of interest but only modest predictive power for child poverty in general. Thus, this second step speaks to the first goal above: to identify what explained the decline from 1993 to 2019.
We look next at economic factors that are associated with, and that contributed to, the decline in child poverty from 1993 to 2019 (Section 3); then, we look at demographic factors (Section 4). For each, we examine influences on rates of both poverty and deep poverty among children.
Section 3: Economic and labor market influences on child poverty
Which economic and labor market factors predict changes in child poverty and deep poverty?
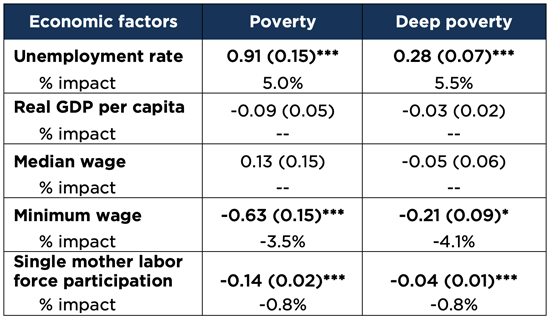
Of the five economic and labor market factors we examined, we find that changes in the unemployment rate, single mother labor force participation rate, and state minimum wage each played a unique and statistically significant role in explaining changes in the rates of child poverty and deep poverty from 1993 to 2019 (see Table 2.1). Specifically, we find that:
-
- Increases in GDP per capita and median wages were not associated with changes in child poverty or deep poverty rates, likely due to increasing inequality in which economic growth and increases in wages at the 50th percentile are not felt for those at the bottom of the income distribution.
- Increases in state-level minimum wages[10] were associated with decreases in child poverty and deep poverty. For every dollar increase in the minimum wage, child poverty rates decreased by 0.63 percentage points (or 3.5% of the average poverty rate during our study period[11]) and deep poverty rates decreased by 0.21 percentage points (or 4.1%).
- Increases in single mothers’ labor force participation were also associated with decreases in both child poverty and deep poverty. For every 1 percentage point increase in single mothers’ labor force participation, child poverty rates decreased by 0.14 percentage points (or 0.8%) and child deep poverty rates decreased by 0.04 percentages points (0.8%).
- Fluctuations in unemployment rates, which rise and fall with economic cycles, were associated with changes in child poverty rates. We find that, for every 1 percentage point change—a decrease or increase—in the unemployment rate, child poverty rates decreased or increased, in the same direction, by about 0.91 percentage points (5.0%); similarly, deep poverty rates decreased or increased by 0.28 percentage points (5.5%).
Table 2.1. Associations Between Changes in Economic Conditions and Changes in Child SPM Poverty Rates, 1993-2019
Which economic and labor market factors explain the decline in child poverty and deep poverty from 1993 to 2019?
To explore the contributions of economic and labor market factors to the decline in child poverty from 1993 to 2019, we used the coefficients from our model to predict what the child poverty and deep poverty rates would have been if each individual economic factor had been the only thing that changed over time—controlling for other economic and labor market factors, demographic factors, and state policy factors.
For example, the unemployment rate decreased from 1993 to 2019, on average (across states, weighted by the size of the state population), by 3.3 percentage points. Holding everything else constant at 1993 levels, this decrease in unemployment corresponded with a 3.0 percentage point decrease in the child poverty rate.
This predicted percent reduction in child poverty due to changes in the unemployment rate is depicted in Figure 2.3. The dashed line in this figure presents the predicted child SPM poverty rate from 1993 to 2019 if only the unemployment rate had changed, and all other factors had stayed constant at 1993 levels. These predicted SPM rates are based, as noted above, on the degree to which the unemployment rate changed from the prior year and the average association between changes in unemployment and changes in child poverty rates. Thus, predicted rates rise and fall as the unemployment rate itself goes up and down.
For instance, the predicted poverty rate during the Great Recession, when unemployment was high, was higher than the actual 1993 poverty rate (shown in the figure by the horizontal gray line). However, because unemployment was lower in 2019 than in 1993, the predicted poverty rate was lower than the actual 1993 rate. The gap between the gray line and the light blue dashed line is the predicted percentage point decrease (or increase) in poverty, compared to 1993, that is explained by changes in unemployment alone. The dark blue line shows the actual child SPM poverty rate to indicate the portion of the total decline in child poverty from 1993 to 2019 that is explained by the decline in unemployment during this time. Here, we see that the 3.0 percentage point decrease in child poverty rates from 1993 to 2019 that is predicted by changes in the unemployment rate accounts for about 18 percent of the total decline in child poverty during this time.
Figure 2.3. Actual and Predicted Child Poverty Rates Assuming Changes in Only Unemployment Rates From 1993-2019
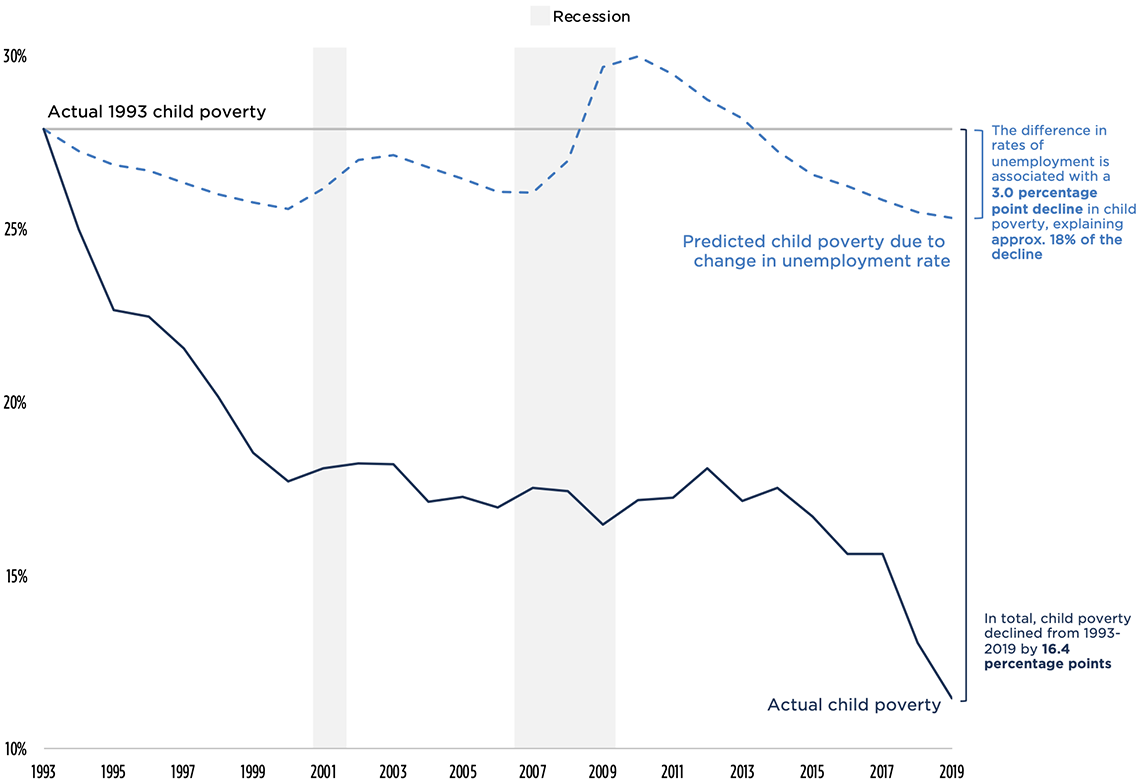
Sources: Child Trends’ analysis of the CPS ASEC, the historical Supplemental Poverty Measure data from the Columbia Center on Poverty and Social Policy, anchored to 2012 thresholds, the Merged Outgoing Rotation Group files of the CPS, the Bureau of Labor Statistics, the U.S. Department of Labor, the Federal Reserve Bank of St. Louis, and the National Center for Health Statistics. Recession data are from the National Bureau of Economic Research.
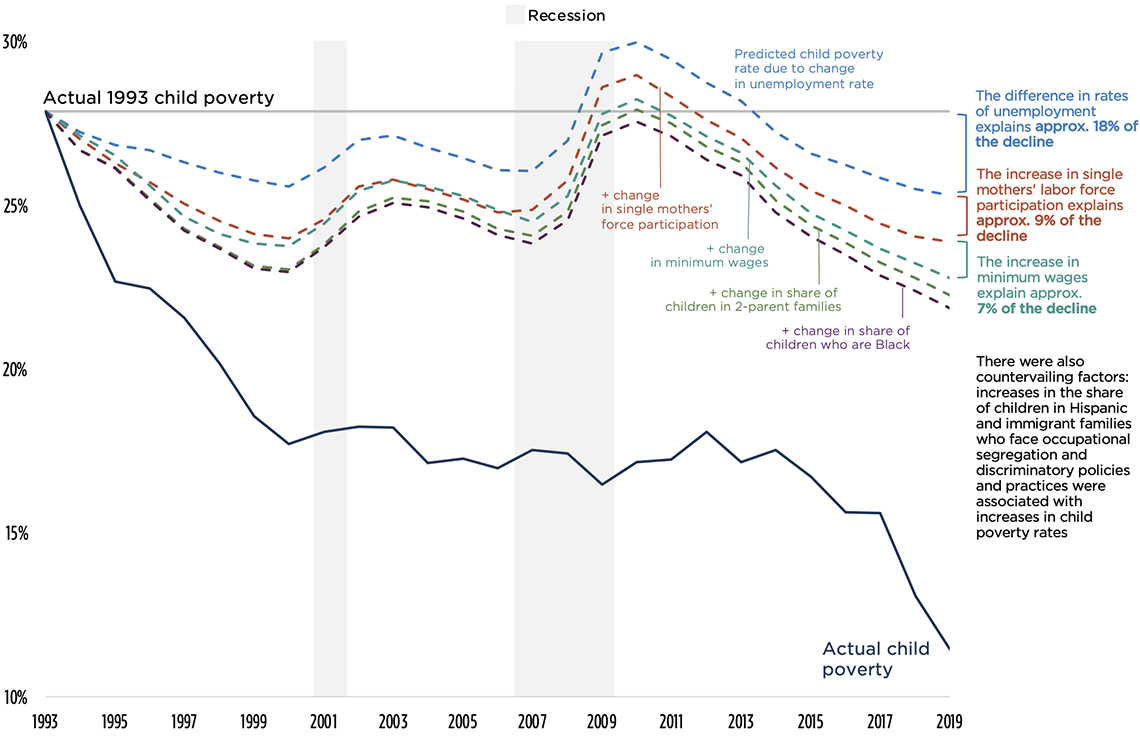
We repeat this process for each economic factor found to be significantly associated with changes in child poverty. In Figure 2.4, each additional colored line represents the additive effect of each new factor combined with the preceding factors. That is, the dark orange line depicts the predicted child poverty rates if the unemployment rate and single mother labor force participation rate were the only factors that changed, and the teal line depicts the predicted poverty rates if unemployment, single mothers’ labor force participation, and minimum wages were the only factors that changed.
Increases in single mothers’ labor force participation occurred mainly prior to 2000 (seen where the gap between the dark orange line and the light blue dashed line increases in the left portion of the graph), then single mothers’ labor force participation decreased slightly through the Great Recession before inching up a bit in recent years. From 1993 to 2019, there was a net increase in single mothers’ labor force participation of 10.3 percentage points, which corresponded with a 1.4 percentage point decrease in child poverty, or about 9 percent of the total decline.
Changes in state minimum wages explained about 7 percent of the decline in child poverty. Increases in state minimum wages mainly occurred in the past 10 years: We can see this in the figure beginning in 2008 where the teal line begins to pull away from the dark orange line, showing the additive effect of changes in state minimum wages to the predicted child poverty rate.
Combined, these three economic factors—unemployment rates, single mothers’ labor force participation, and state minimum wages—explained about one third of the decline in child poverty from 1993 to 2019. For a summary of the contribution of each economic factor to the decline, see Table 2.2.
Figure 2.4. Actual and Predicted Child Poverty Rates Assuming Changes in Only Economic Factors From 1993-2019
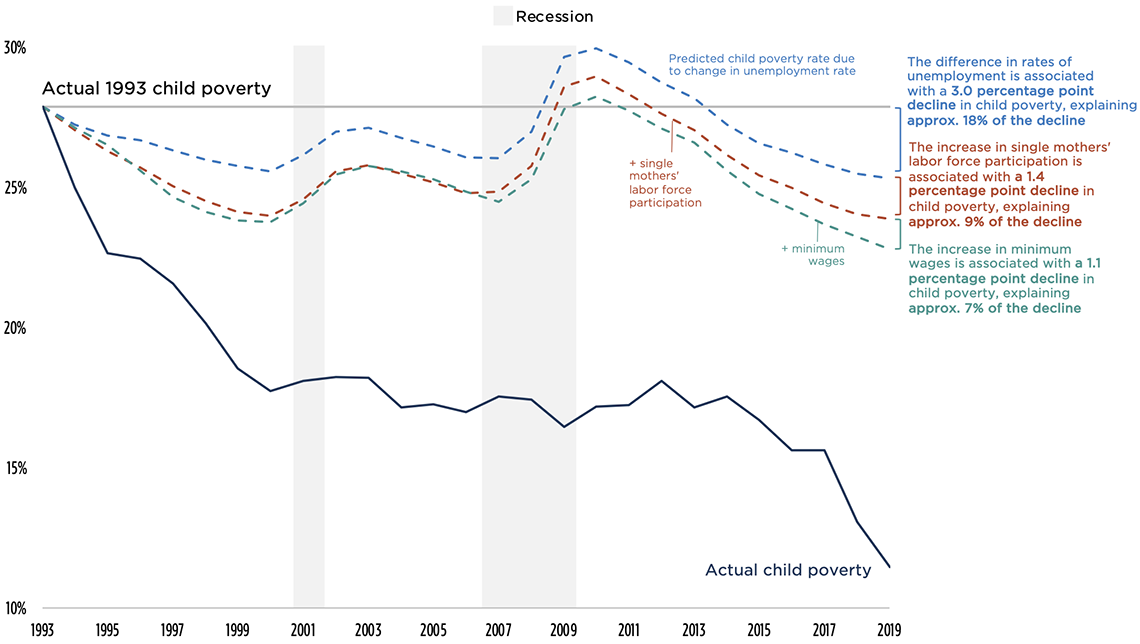
Note: Each additional colored line represents the additive effect of each new factor combined with the preceding factors. That is, the dark orange line depicts the predicted child poverty rates if the unemployment rate and single mothers’ labor force participation (SM LFP) were the only factors that changed, and the teal line depicts the predicted poverty rates if unemployment, SM LFP, and state minimum wages were the only factors that changed. Where a line crosses over the preceding line, that factor is reversing its decrease (or increase) such that it is putting upward pressure on child poverty rates for a short period of time.
Sources: Child Trends’ analysis of the CPS ASEC, the historical Supplemental Poverty Measure data from the Columbia Center on Poverty and Social Policy, anchored to 2012 thresholds, the Merged Outgoing Rotation Group files of the CPS, the Bureau of Labor Statistics, the U.S. Department of Labor, the Federal Reserve Bank of St. Louis, and the National Center for Health Statistics. Recession data are from the National Bureau of Economic Research.
We see a similar story when it comes to deep poverty among children (see Figure 2.5): Changes in the unemployment rate explained about 22 percent of the decline in deep poverty among children from 1993 to 2019. Changes in single mothers’ labor force participation explained about 10 percent of the total decline. Increases in state minimum wages explained about 9 percent of the decline. Combined, these three economic factors explained about two fifths of the decline (41%) in deep poverty among children from 1993 to 2019, suggesting that economic and labor market factors played a slightly larger role in explaining the decline in deep poverty than for poverty.
Deep poverty
Deep poverty is defined as having an income less than 50 percent of the SPM poverty threshold, or less than approximately $14,440 for a two-adult, two-child household that rents.
Children in deep poverty are diverse and live in suburban, urban, and rural areas. Most live in families headed by a single parent. They represent a diversity of races and ethnicities: In 2016, 37 percent were White, 23 percent were Black, and 30 percent were Hispanic. Deep poverty is linked to multiple and complex barriers to employment that disproportionately affect families living in deep poverty, including unstable housing, unreliable child care, lack of education, and mental and physical health problems that aren’t severe enough to qualify for disability.
Figure 2.5. Actual and Predicted Child Deep Poverty Rates Assuming Changes in Only Economic Factors From 1993-2019
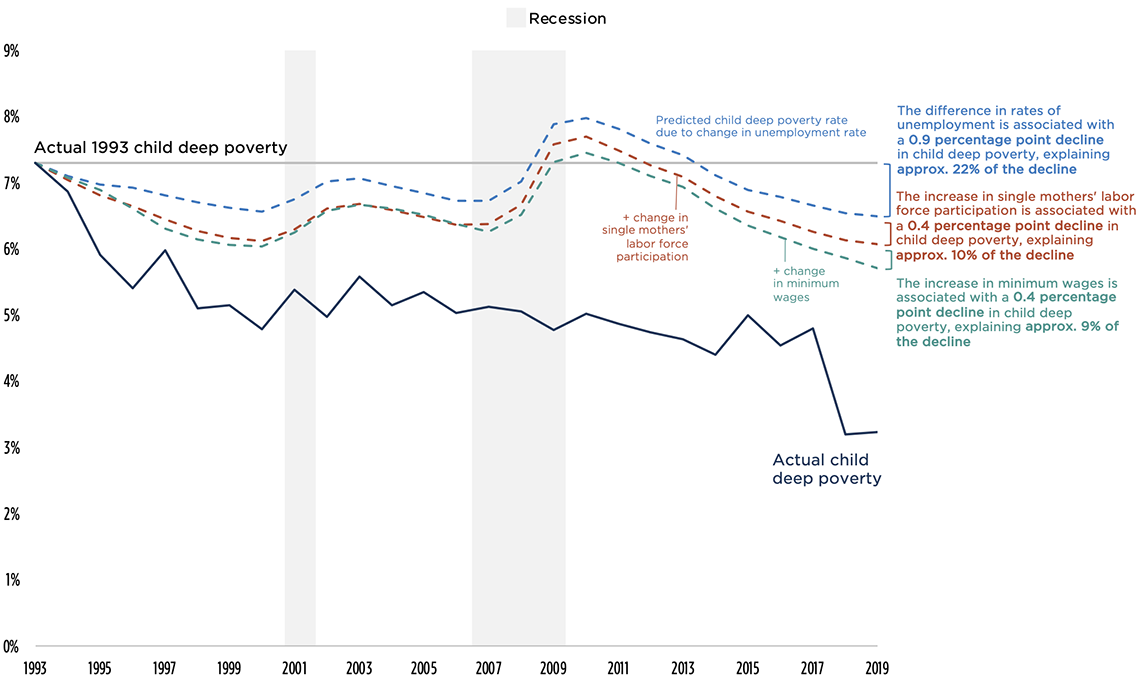
Note: Each additional colored line represents the additive effect of each new factor combined with the preceding factors. That is, the dark orange line depicts the predicted child poverty rates if the unemployment rate and single mothers’ labor force participation (SM LFP) were the only factors that changed, and the teal line depicts the predicted poverty rates if unemployment, SM LFP, and state minimum wages were the only factors that changed. Where a line crosses over the preceding line, that factor is reversing its decrease (or increase) such that it is putting upward pressure on child poverty rates for a short period of time.
Sources: Child Trends’ analysis of the CPS ASEC, the historical Supplemental Poverty Measure data from the Columbia Center on Poverty and Social Policy, anchored to 2012 thresholds, the Merged Outgoing Rotation Group files of the CPS, the Bureau of Labor Statistics, the U.S. Department of Labor, the Federal Reserve Bank of St. Louis, and the National Center for Health Statistics. Recession data are from the National Bureau of Economic Research.
Table 2.2. Predicted Percentage Point Change and Percent of Total Decline in Child Poverty and Deep Poverty Due to Economic and Labor Market Factors, 1993-2019
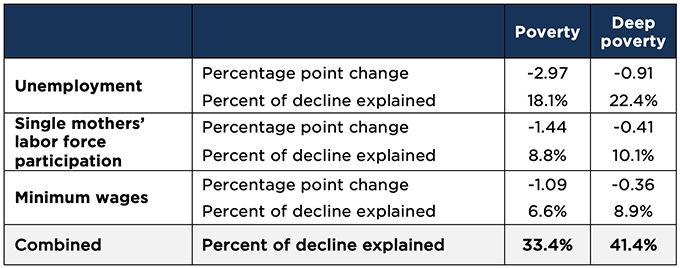
Note: To contextualize these findings, a percentage point reduction in child poverty across this time period is equivalent to approximately 724,000 fewer children in poverty. For example, increases in real minimum wages from 1993 to 2019 were associated with a 1.1 percentage point decrease in child poverty and a 0.4 percentage point decrease in deep poverty. This amounts to about 800,000 fewer children in poverty and nearly 300,000 fewer children in deep poverty over this 26-year time period. (Calculations for the number of children living in poverty are based on the average child population from 1993 to 2019 published by Kids Count Data Center.)
Sources: Child Trends’ analysis of the CPS ASEC, the historical Supplemental Poverty Measure data from the Columbia Center on Poverty and Social Policy, anchored to 2012 thresholds, the Merged Outgoing Rotation Group files of the CPS, the Bureau of Labor Statistics, the U.S. Department of Labor, the Federal Reserve Bank of St. Louis, and the National Center for Health Statistics.
Section 4: Demographic influences on child poverty
Which demographic factors predict changes in child poverty and deep poverty?
We turn now to the influence of shifting demographic trends on changes in child poverty and deep poverty from 1993 to 2019. Specifically, we look at associations between changes in child poverty and changes in teen birth rates (the number of births per 1,000 females ages 15-19), the share of the adult population (ages 25 and older) who have a high school degree or higher, the share of children living in two-parent families, the racial and ethnic composition of the child population, and the share of children living in immigrant families.
We find the following:
-
- Changes in the share of children living in two-parent families, Black children, Hispanic children, and children in immigrant families—each of whom face specific sets of barriers to economic mobility—were associated with changes in the rates of child poverty (see Table 2.3). Changes in the share of children living in two-parent families and the share of children living in immigrant families were also associated with changes in rates of deep poverty among children.
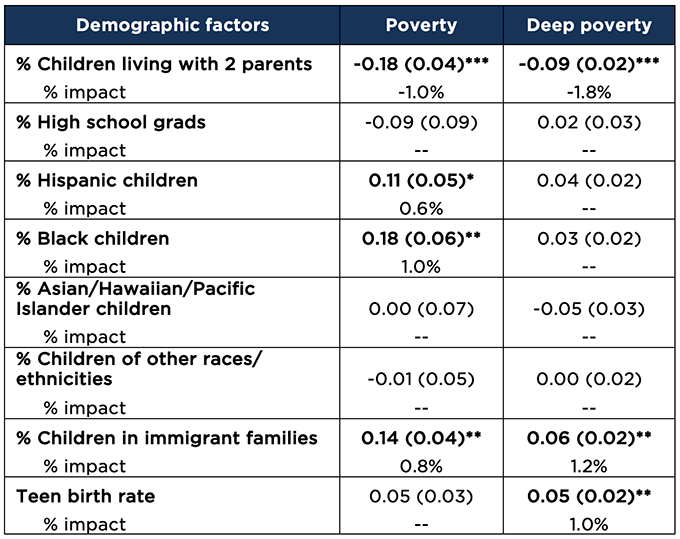
- Children in two-parent families: A 1 percentage point increase in the share of children living in two-parent families—which is to say, the share of children living in a family structure that tends to confer greater earnings potential, access to resources and support, and ability to navigate child care needs more flexibly—was associated with a 0.18 percentage point (or 1.0%) decrease in child poverty and a 0.09 percentage points (or 1.8%) decrease in deep poverty.
- Black children: A 1 percentage point decrease (or increase) in the share of Black children—who are disproportionately likely to live in families that face significantly lower wages and fewer benefits, employment discrimination, and occupational segregation—was associated with a 0.18 percentage point (or 1.0%) decrease (or increase) in rates of child poverty. Changes in the share of Black children were not associated with changes in rates of deep poverty.
- Hispanic children: A 1 percentage point increase in the share of Hispanic children—who are more likely to live in families that tend to have high levels of labor force participation but also face employment discrimination and occupational segregation in low-wage jobs and less job security, and who are often excluded from safety net programs—was associated with a 0.11 percentage point (or 0.6%) increase in child poverty. Changes in the share of Hispanic children were not associated with changes in rates of deep poverty.
- Children in immigrant families: A 1 percentage point increase in the share of children living in immigrant families—who are more likely to face language and other barriers to accessing employment; to be concentrated in low-wage jobs, with non-standard work schedules, less safe work conditions, and fewer benefits; and who are excluded from accessing many safety net programs—was associated with a 0.14 percentage point (or 0.8%) increase in rates of child poverty and a 0.06 percentage point (or 1.2%) increase in rates of deep poverty.
- Changes in teen birth rates were significantly associated with changes in rates of deep poverty among children. However, teen birth rates may be either a symptom of child deep poverty or a potential contributor to it, so the relationship between these indicators may be reciprocal, or bidirectional: That is, while declines in teen birth rates may have helped explain declines in child deep poverty, it is also possible that fewer children in deep poverty helped to explain the decline in teen births. Every 1 fewer birth per 1,000 females ages 15 to 19 was associated with a 0.05 percentage point (or 1.0%) decline in deep poverty. There was no association between changes in teen birth rates and child poverty.
- Increases in the share of adults who have a high school degree or higher were not associated with changes in either child poverty or deep poverty rates. This may be because high school degrees have become less valued on the job market as postsecondary education has become more common and required for many “good jobs.”
- Changes in the share of children living in two-parent families, Black children, Hispanic children, and children in immigrant families—each of whom face specific sets of barriers to economic mobility—were associated with changes in the rates of child poverty (see Table 2.3). Changes in the share of children living in two-parent families and the share of children living in immigrant families were also associated with changes in rates of deep poverty among children.
Table 2.3. Associations Between Changes in Demographic Conditions and Changes in Child SPM Poverty Rates, 1993-2019
Which demographic factors explain the decline in child poverty and deep poverty from 1993 to 2019?
We now examine the extent to which demographic factors contributed to the decline in child poverty from 1993 to 2019. As we did when looking at economic and labor market factors, we use the coefficients from our model to predict what the child poverty and deep poverty rates would have been if each demographic factor considered had been the only thing that changed over time—all while controlling for the other demographic, economic and labor market, and state policy factors.
Children in two-parent families and Black children: There was little change from 1993 to 2019 in the share of children living with two parents and the share of Black children, so these factors explained only small portions of the overall decline—3 percent and 2 percent, respectively.
Hispanic children and children in immigrant families: There were also countervailing forces that put upward pressure on child poverty rates. Specifically, the rising shares of children in Hispanic and immigrant families—many of whom face systemic barriers to accessing employment and exclusionary policies that limit anti-poverty efforts—were associated with an increase of 1.3 and 1.5 percentage points, respectively, in overall child poverty rates.
As a whole, demographic factors (after accounting for countervailing forces) did not contribute to the decline in child poverty. Rather, the demographic shifts from 1993 to 2019—particularly the increased share of children living in households that experience significant barriers to economic mobility—put upward pressure on child poverty rates. In other words, it is likely that the systemic barriers faced by Hispanic and immigrant families inhibited further declines in child poverty.
Figure 2.6. Actual and Predicted Child Poverty Rates Assuming Changes in Only Economic and Select Demographic Factors From 1993-2019
While demographic factors did not contribute to the decline in child poverty from 1993 to 2019, they were associated with the decline in deep poverty among children. The decline in teen birth rates was associated with a 2.1 percentage point reduction in deep poverty, which corresponds with a stunning 52 percent of the decline (see Figure 2.7). Increases in the share of children living with two parents were associated with a 0.3 percentage point reduction in deep poverty, explaining 7 percent of the decline.
As we saw when looking at contributors to the decline in child poverty, there were also countervailing forces that put upward pressure on deep poverty rates. Specifically, the rising share of children in immigrant families was associated with a 0.7 percentage point increase in the rate of deep poverty among children.
Combined, these demographic factors (including the countervailing forces) explained about 43 percent of the decline in deep poverty from 1993 to 2019.
Figure 2.7. Actual and Predicted Child Deep Poverty Rates Assuming Changes in Only Economic and Select Demographic Factors From 1993-2019
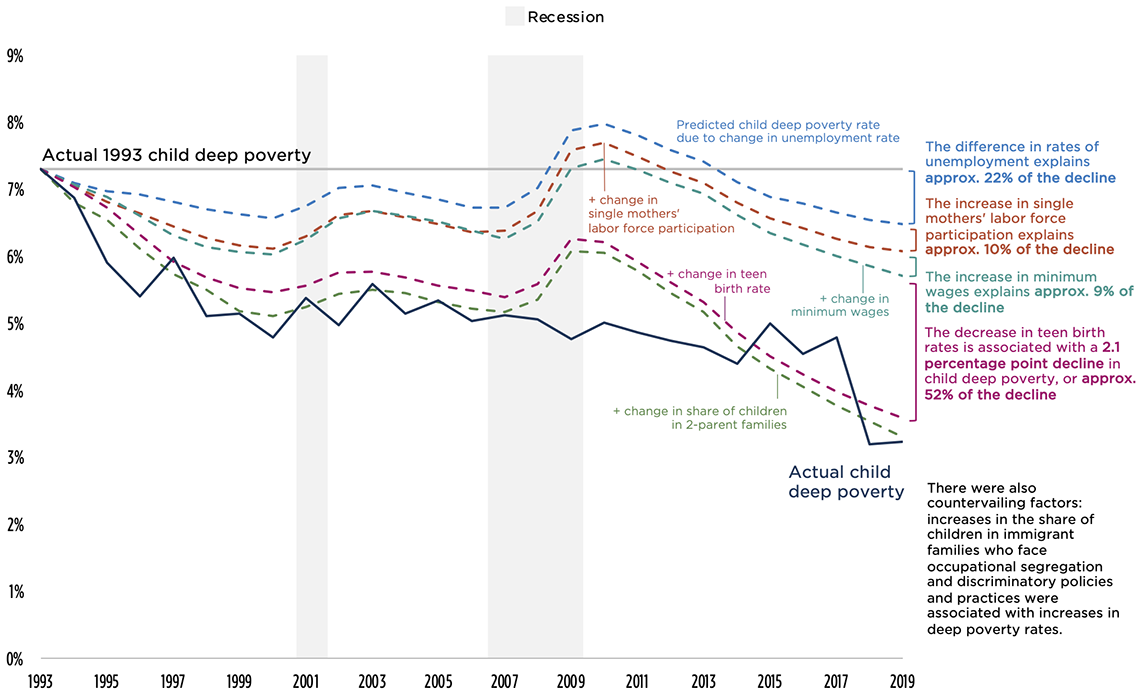
Table 2.4. Predicted Percentage Point Change and Percent of Total Decline in Child Poverty and Deep Poverty Due to Demographic Factors, 1993-2019
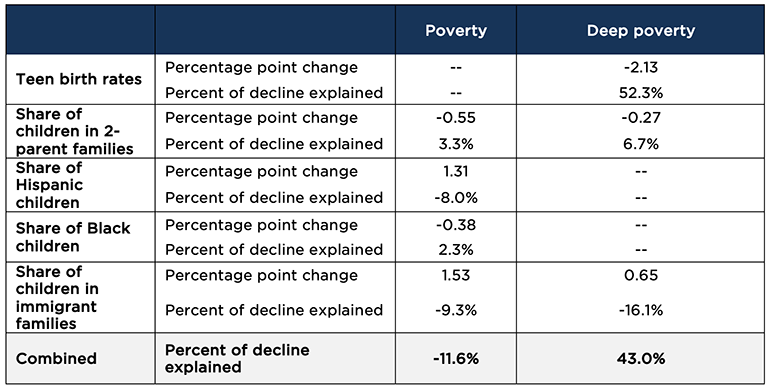
Note: To contextualize these findings, a percentage point reduction in child poverty across this time period is equivalent to approximately 724,000 fewer children in poverty. (Calculations for the number of children living in poverty are based on the average child population from 1993 to 2019 published by Kids Count Data Center.)
Sources: Child Trends’ analysis of the CPS ASEC, the historical Supplemental Poverty Measure data from the Columbia Center on Poverty and Social Policy, anchored to 2012 thresholds, the Merged Outgoing Rotation Group files of the CPS, the Bureau of Labor Statistics, the U.S. Department of Labor, the Federal Reserve Bank of St. Louis, and the National Center for Health Statistics.
Section 5: Economic and demographic influences on child poverty rates by subgroup
We also looked at how the influences of economic and demographic factors on child poverty rates varied by subgroup. We separately examined the extent to which each economic and demographic[12] factor was associated with poverty rates for White children, Black children, Hispanic children, children living with single or no parents, children living with two parents, and children living in immigrant and non-immigrant families.[13] We consider this analysis exploratory and, while we tested for significant associations between factors and groups, we did not test for significant differences between groups. Below, we present noteworthy findings that focus on the percent difference by which each factor changed poverty rates for the subgroups considered:[14]
-
- Changes in unemployment rates were associated with a larger percent change[15] in child poverty rates among White children, children living with two parents, and children living in immigrant families than among the other groups. A one percentage point decrease in unemployment is associated with a 6.2 percent decrease in the poverty rate for White children, a 6.5 percent decrease for children living with two parents, and a 6.7 percent decrease among children living in immigrant families. Additional analyses are needed to examine whether increases in unemployment rates, compared to decreases, influence subgroup poverty rates in similar or different ways.
- Increases in GDP per capita were associated with declines in poverty rates among children living with two parents (a 1.1% decline), suggesting that macroeconomic growth may have more of a positive influence on the economic well-being of two-parent families.
- Increases in state minimum wages were associated with a larger percent decline in poverty rates among Black children (5.8%) and—to a slightly smaller degree—among Hispanic children (4.5%) and children in immigrant families (4.2%). This may be because Black, Hispanic, and immigrant families are disproportionately more likely to work in lower-wage jobs and thus more likely to benefit from an increase in the minimum wage.
- Increases in single mothers’ labor force participation were associated with a larger percent decline in poverty rates among Black children (1.7%). Black women have the highest labor force participation of all women, and Black children have the highest rates of living in single-parent families (the vast majority of which are led by single mothers); this suggests that single mothers’ labor force participation may play a more important role in lowering child poverty rates among Black children in particular.
- Increases in the share of the adult population with at least a high school degree were associated with declines in poverty rates among Black children (2.3% decline) and children living in non-immigrant families (1.7% decline).
In sum, our findings suggest that declines in unemployment and increases in state minimum wages tended to be associated with lower poverty rates for most subgroups. White children, children in two-parent families, and children in immigrant families potentially experience more poverty-reduction benefits from lower unemployment, and Black and Hispanic children and children in immigrant families potentially experience greater benefits from increases in state minimum wages. Meanwhile, increases in single mothers’ labor force participation were associated with decreases in poverty rates primarily among Black children.
Section 6: Discussion of key findings
Changes in economic and demographic trends from 1993 to 2019 help explain the unprecedented decline in child poverty across this time period. Specifically, unemployment was a strong determinant of child poverty and deep poverty. This aligns with previous research indicating that low-wage earners are disproportionally impacted by economic downturns.
Increases in real, inflation-adjusted state minimum wages were associated with decreases in rates of poverty and deep poverty among children, but changes in median wages were not associated with either. This points to the need to counter rising rates of income inequality to ensure that increases in wages are felt by those at the lower ends of the income spectrum in order to prevent poverty and deep poverty among children.
Increases in single mothers’ labor force participation and in the share of children living in two-parent families were also associated with decreases in child poverty. The associations between each of these factors and child poverty and deep poverty rates were strong. The increase in single mothers’ labor force participation—which occurred during the 1990s alongside expansion of the EITC, decreasing unemployment, and welfare reform—explains about 9 percent the decline in child poverty during this time. In contrast, because the increase in the share of children living with two parents was relatively muted, this factor explains only small overall decreases in child poverty from 1993 to 2019. Nonetheless, both factors are potential policy levers for further poverty reduction.
We additionally find that increases in the share of children whose families face specific barriers to accessing good jobs and/or have limited access to social safety net programs—specifically children in Hispanic, Black, and immigrant families—are associated with increases in child poverty rates. As our country continues to become more racially and ethnically diverse and the share of immigrants grows, public policies to address poverty will fall short of their potential if they do not specifically and systematically address discrimination and structural barriers that prevent people of color and immigrants from fully accessing the labor market and the social safety net (see Chapter 4).
Finally, decreases in teen birth rates were associated with decreases in child deep poverty. Holding everything else constant, the 72 percent decrease in teen birth rates from 1993 to 2019 corresponded with 52 percent of the decrease in deep poverty over the past quarter century. Researchers have attributed declines in the teen birth rate to less teen sex and to more contraceptive use; these shifts, in turn, may have been due to media and messaging campaigns, the availability of effective contraceptive methods, and pregnancy prevention programs. These efforts may also continue to help keep child deep poverty rates low; however, because teen birth rates are currently at a historic low, further reductions in teen births may be less dramatic.
Combined, the economic and labor market factors we considered explain about 33 percent of the decline in child poverty from 1993 to 2019, while demographic factors—net of countervailing forces—did not contribute to the decline. Economic and demographic factors each explain larger portions of the decline in deep poverty rates among children—41 percent and 43 percent, respectively—than of the decline in all child poverty (see Table 2.5).
Table 2.5. Predicted Percentage Point Change and Percent of Total Decline in Child Poverty and Deep Poverty Due to Economic, Labor Market, and Demographic Factors, 1993-2019
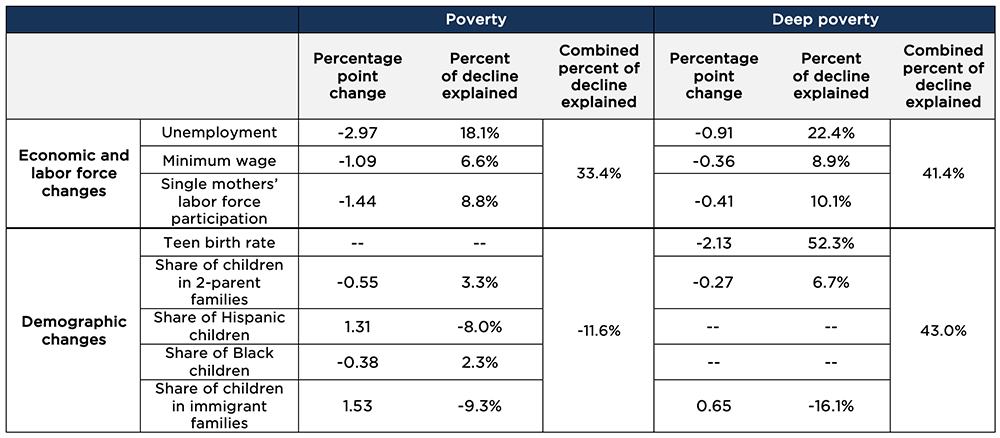
Sources: Child Trends’ analysis of the CPS ASEC, the historical Supplemental Poverty Measure data from the Columbia Center on Poverty and Social Policy, anchored to 2012 thresholds, the Merged Outgoing Rotation Group files of the CPS, the Bureau of Labor Statistics, the U.S. Department of Labor, the Federal Reserve Bank of St. Louis, and the National Center for Health Statistics.
As seen in Figures 2.8 and 2.9, when economic and demographic factors are considered together, they explain a little over one fifth of the decline in child poverty but more than four fifths of the decline in child deep poverty from 1993 to 2019. This means that most of the decline in poverty remains unexplained by our economic and demographic models.
In Chapter 3, we investigate an additional factor that may help explain the remaining, as-yet-unexplained portion of the declines seen in poverty and deep poverty from 1993 to 2019.[16] We will look specifically at the roles of federal social safety net programs in protecting children from poverty and deep poverty, as well as how these roles have changed over time.
Figure 2.8. Actual and Predicted Poverty Rates Among Children Assuming Changes in Only Economic and Demographic Factors From 1993-2019
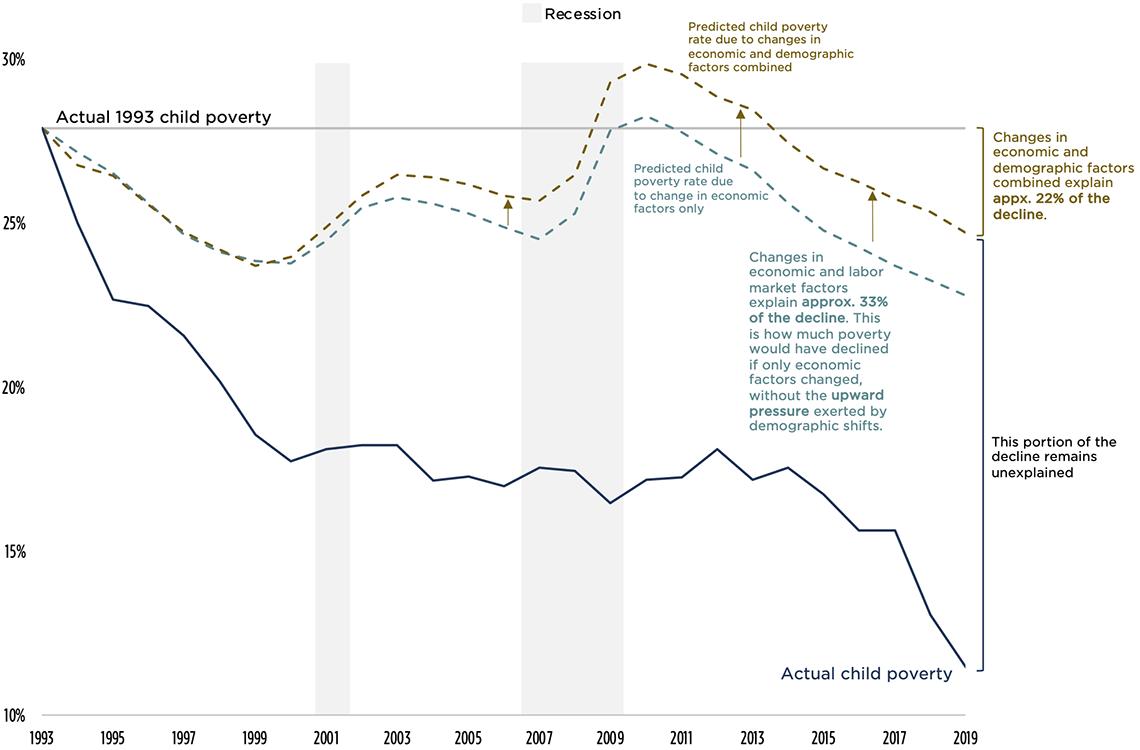
Figure 2.9. Actual and Predicted Deep Poverty Rates Among Children Assuming Changes in Only Economic and Demographic Factors From 1993-2019
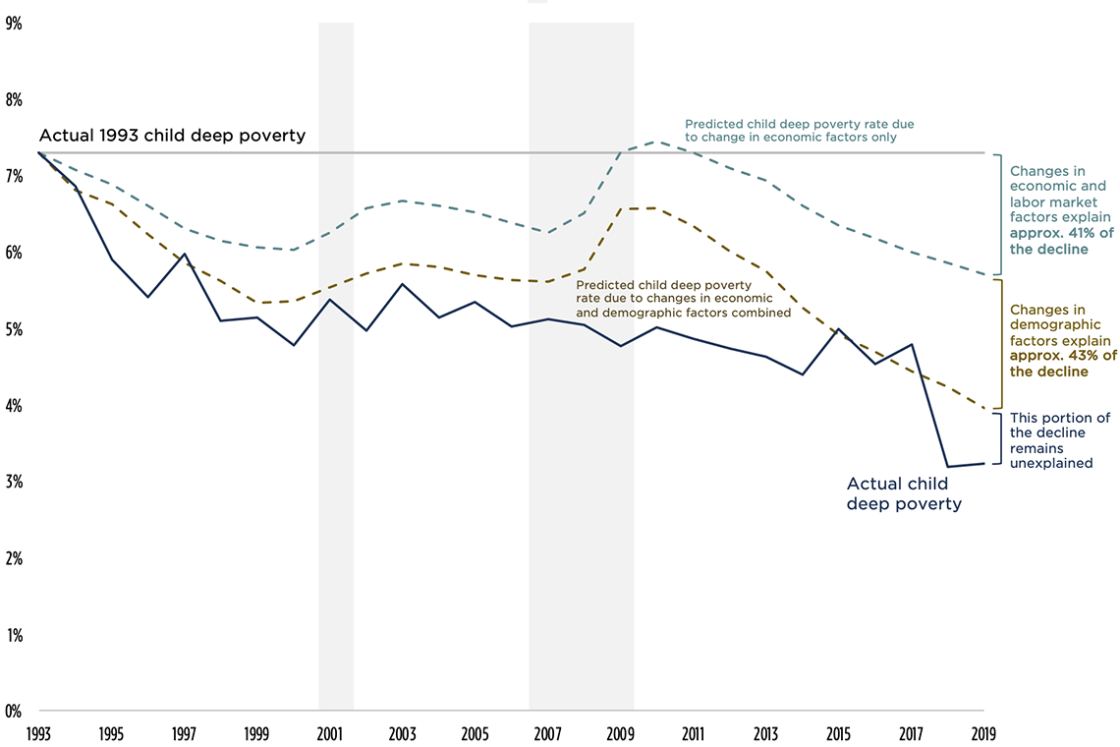
Note for 2.8 and 2.9: Each additional colored line represents the additive effect of each new factor combined with the preceding factors.
Sources for 2.8 and 2.9: Child Trends’ analysis of the CPS ASEC, the historical Supplemental Poverty Measure data from the Columbia Center on Poverty and Social Policy, anchored to 2012 thresholds, the Merged Outgoing Rotation Group files of the CPS, the Bureau of Labor Statistics, the U.S. Department of Labor, the Federal Reserve Bank of St. Louis, and the National Center for Health Statistics. Recession data are from the National Bureau of Economic Research.
Click to continue to Chapter 3: The Role of the Social Safety Net in Protecting Children from Poverty
View Chapter 3Chapter 2 Endnotes
[1] While interactions between economic and demographic factors and social policies can influence child poverty rates, we do not directly examine these interactions in the current study.
[2] The estimates presented in the figure and reported in the text are based on national averages of state-year data that are weighted by the state total population (or child population for child-population-based estimates) in a given year. As such, they approximate national averages but may not exactly match national estimates. As our subsequent analyses use state-level data, we also use them here to describe national trends for consistency. Estimates are reported in 2019 dollars. Sources for our state-year data are detailed in our Methods chapter.
[3] As of 2022, 30 states and Washington, DC have minimum wages above the federal minimum wage. When state minimum wages are higher than the federal minimum wage, the state minimum wage applies to workers in those states; if the state minimum wage is equal to or lower than the federal minimum wage, the federal minimum wage applies. To estimate minimum wages across the country, we generate an average of minimum wages across all 50 states plus DC, which is weighted by the total population of each state.
[4] Prior research has found that the expansion of the EITC explained about one third (34%) of the increase in employment among single mothers from 1993 to 1999 and 21 percent of the increase in earnings among female-headed families. A tighter labor market explained 21 percent of the increase in single mothers’ employment and 8 percent of the increase in earnings. Welfare reform policies explained 13 percent of the increase in single mothers’ employment but had a negative impact on earnings.
[5] The child pre-tax-and-transfer (PTT) poverty rate follows a very similar pattern to child poverty rates as measured by the Official Poverty Measure (OPM), which is primarily based on market income and, for the most part, does not account for government tax and transfer programs. For two reasons, we prefer to use PTT poverty (rather than OPM poverty) as an indicator of what poverty would be if only income (and no government programs) were taken into account. First, PTT is more easily comparable to the Supplemental Poverty Measure (SPM) because it uses the same poverty thresholds as the SPM, whereas the OPM uses a different threshold. Second, PTT poverty is a slightly cleaner measure of market-income-based poverty because it subtracts out all government programs, whereas the OPM includes some cash assistance programs.
[6] We operationalize race and ethnicity with four categories, following the precedent of the Census Bureau: Non-Hispanic Asian/Hawaiian/Pacific Islander, non-Hispanic Black, Hispanic, and non-Hispanic White. Throughout the report, we drop “non-Hispanic” from descriptions for parsimony.
[7] The percent increase is calculated using unrounded numbers and may not exactly match those generated from the rounded numbers presented in the text. Discrepancies due to rounding are particularly notable when the denominator includes very small numbers, as with the share of Asian/Hawaiian/Pacific Islander children.
[8] The Current Population Survey changed how it asked about race and ethnicity in 2003, limiting the groups that we could examine over time. We were not able to include American Indian or Alaska Native (AIAN) children in our analyses. Samples of AIAN children are limited to 500 to 600 children per year, and results are too unstable to present.
[9] Prior literature has found income inequality to explain changes in poverty in earlier decades. However, much of the recent increases in income inequality have been driven by disproportionate increases in income among the top 5 percent of earners (i.e., the 95th percentile). There has been little change in disparities in incomes at the 50th compared to the 10th percentiles. Therefore, we decided not to include a measure of income inequality in our models. Instead, we captured changes in inequality by including both median wage and minimum wage in our models: The former is a concrete measure of what’s happening at the middle and the latter is a concrete measure of policy levers at the bottom. Including both measures allowed us to examine their unique influence on changes in child poverty rates. Prior literature has also noted links between female labor force participation and changes in poverty during the 1980s, a period in which female labor force participation was increasing rapidly. During our time period of interest (1993 to 2019), though, female labor force participation remained relatively stable. Single mothers’ labor force participation, however, did increase about 10 percentage points during this time; these changes would be expected to be even more related to changes in child poverty, given the high rates of poverty among children in single female-headed families. For these reasons, our models include single mother labor force participation, rather than female labor force participation more broadly.
[10] Technically, the coefficients refer to the change in child poverty associated with an increase or decrease in minimum wages. Here, we use increase as a shorthand, even though the real value of state-level minimum wages, for example, does decrease between some of the years examined due to inflation.
[11] To allow for easier comparisons across poverty levels, we calculate the “percent impact” of the association between each significant factor and child poverty and deep poverty rates. We do this by dividing each coefficient by the mean poverty and deep poverty rate, respectively, across the time period. The “percent impact” can be interpreted as the percent change in poverty or deep poverty associated with a 1 unit change in the factor. These are presented parenthetically throughout this section.
[12] When examining the relationship between demographic factors and child poverty rates by race and ethnicity, family structure, and whether a child lives in an immigrant family, we focused on a subset of demographic factors: teen birth rates, single mothers’ labor force participation, and education attainment, excluding the racial and ethnic composition indicators, which overlap with the subgroups examined.
[13] We also looked at associations between each factor and poverty rates among Asian/Hawaiian/Pacific Islander children, but we do not present these estimates, as they were imprecise with large standard errors due to the smaller sample size of children in this subgroup .
[14] Tabled results available upon request.
[15] For significant associations between factors and groups, we report the percent change in the mean child poverty rate for the subgroup that would accompany a one unit change in the respective economic or demographic factor. This allows for easier comparisons of the relative role across subgroups where the mean child poverty level is different. Because each model is run separately (with the subgroup child poverty rate as the dependent variable), we did not test for significant differences across groups. Therefore, we mostly limit our discussion to trend-level differences in the percent impact of each economic or demographic factor on the child poverty rates for each subgroup.
[16] Some of the as-yet-unexplained portion of the declines in child poverty and deep poverty may also be explained by national trends in economic and demographic factors that affect all states at the same time, or by unmeasured time-varying factors (beyond those we included in the model) that impact individual states or groups of states. See our Methods chapter for more details on the limitations of our state and year fixed effects models.
© Copyright 2024 ChildTrendsPrivacy Statement
Newsletter SignupLinkedInThreadsYouTube